Advertisements
Advertisements
Question
The following table shows the market position of different brands of tea-leaves.
| Brand | A | B | C | D | others |
| % of Buyers | 35 | 20 | 20 | 15 | 10 |
Draw it-pie-chart to represent the above information.
Advertisements
Solution
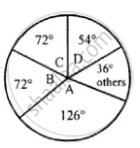
| Name of brand | % of Buyers | Central angle |
| A | 35 | `35/100 xx 360^circ = 126^circ` |
| B | 20 | `20/100 xx 360^circ = 72^circ` |
| C | 20 | `20/100 xx 360^circ = 72^circ` |
| D | 15 | `15/100 xx 360^circ = 54^circ` |
| Others | 10 | `10/100 xx 360^circ = 36^circ` |
| 100 | `360^circ` |
APPEARS IN
RELATED QUESTIONS
The following data on the number of girls (to the nearest ten) per thousand boys in different sections of Indian society is given below.
| Section | Number of girls per thousand boys |
| Scheduled Caste (SC) | 940 |
| Scheduled Tribe (ST) | 970 |
| Non SC/ST | 920 |
| Backward districts | 950 |
| Non-backward districts | 920 |
| Rural | 930 |
| Urban | 910 |
- Represent the information above by a bar graph.
- In the classroom discuss what conclusions can be arrived at from the graph.
Read the bar graph shown in Fig. 23.10 and answer the following questions
(i) What is the information given by the bar graph?

(ii) What was the number of commercial banks in 1977?
(iii) What is the ratio of the number of commercial banks in 1969 to that in 1980?
(iv) State whether true or false:
The number of commercial banks in 1983 is less than double the number of commercial banks in 1969.
Read the following bar graph(Fig. 23.15) and answer the following questions:
(i) What information is given by the bar graph?
(ii) What was the production of a student in the year 1980 - 81?
(iii) What is the minimum and maximum productions of cement and corresponding years?

Explain the reading and interpretation of bar graphs.
The population of Delhi State in different census years is as given below:
| Census year | 1961 | 1971 | 1981 | 1991 | 2001 |
| Population in Lakhs | 30 | 55 | 70 | 110 | 150 |
The investment (in ten crores of rupees) of Life Insurance Corporation of India in different sectors are given below:
| Sectors | Investment (in ten crores of rupees) |
| Central Government Securities State Government Securities Securities guaranteed by the Government Private Sectors Socially oriented sectors (Plans) Socially oriented sectors (Non-Plan) |
45 11 23 18 46 11 |
Represent the above data with the help of bar graph.
Construct a histogram for the following data:
| Monthly School fee (in Rs): |
30-60 | 60-90 | 90-120 | 120-150 | 150-180 | 180-210 | 210-240 |
| No of Schools | 5 | 12 | 14 | 18 | 10 | 9 | 4 |
In a histogram the area of each rectangle is proportional to
Draw frequency polygons for each of the following frequency distribution:
(a) using histogram
(b) without using histogram
|
C.I |
5 -15 | 15 -25 | 25 -35 | 35 - 45 | 45-55 | 55-65 |
| ƒ | 8 | 16 | 18 | 14 | 8 | 2 |
A hundred students from a certain locality use different modes of travelling to school as given below. Draw a bar graph.
| Bus | Car | Rickshaw | Bicycle | Walk |
| 32 | 16 | 24 | 20 | 8 |
