Advertisements
Advertisements
Question
In the following table, the investment made by 210 families is shown. Present it in the form of a histogram.
|
Investment
(Thousand Rupees) |
10 - 15 | 15 - 20 | 20 - 25 | 25 - 30 | 30 - 35 |
| No. of families | 30 | 50 | 60 | 55 | 15 |
Advertisements
Solution
The histogram for the given data is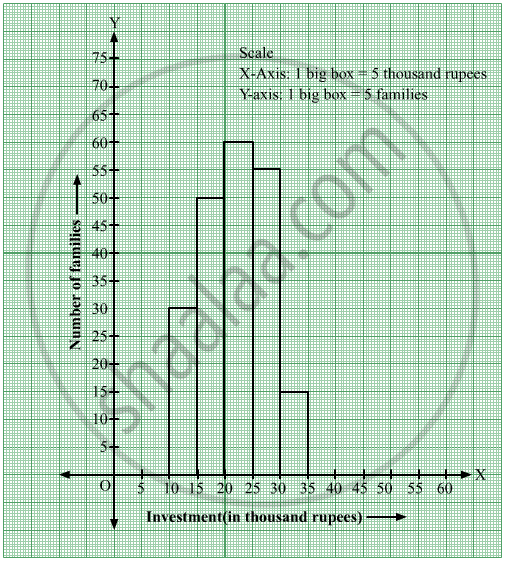
APPEARS IN
RELATED QUESTIONS
The marks scored by students in Mathematics in a certain Examination are given below:
| Marks Scored | Number of Students |
| 0 — 20 | 3 |
| 20 — 40 | 8 |
| 40 — 60 | 19 |
| 60 — 80 | 18 |
| 80 — 100 | 6 |
Draw histogram for the above data.
Draw histogram and frequency polygon on the same graph paper for the following frequency distribution
| Class | Frequency |
| 15-20 | 20 |
| 20-25 | 30 |
| 25-30 | 50 |
| 30-35 | 40 |
| 35-40 | 25 |
| 40-45 | 10 |
Time alloted for the preparation of an examination by some students is shown in the table. Draw a histogram to show the information.
| Time (minutes) | 60 - 80 | 80 - 100 | 100 - 120 | 120 - 140 | 140 - 160 |
| No. of students | 14 | 20 | 24 | 22 | 16 |
Find the correct answer from the alternatives given.
|
No. of trees planted by each student |
1 - 3 | 4 - 6 | 7 - 9 | 10 - 12 |
| No. of students | 7 | 8 | 6 | 4 |
The above data is to be shown by a frequency polygon. The coordinates of the points to show number of students in the class 4-6 are . . . .
The age groups and the number of persons in the age groups, who donated blood in blood donation camp is given below. Find the measures of central angles to show the information by a pie diagram.
| Age group (Years) | 20-25 | 25-30 | 30-35 | 35-40 |
| No of persons | 80 | 60 | 35 | 25 |
The following table is based on the marks of the first term examination of 10th class students. Show the information by a histogram. Also, draw a frequency polygon with the help of the histogram.
| Class-mark of marks | 325 | 375 | 425 | 475 | 525 | 575 |
| No. of students | 25 | 35 | 45 | 40 | 32 | 20 |
The weekly wages (in Rs.) of 30 workers in a factory are given:
830, 835, 890, 810, 835, 836, 869, 845, 898, 890, 820, 860, 832, 833, 855, 845, 804, 808, 812, 840, 885, 835, 835, 836, 878, 840, 868, 890, 806, 840
Mark a frequency table with intervals as 800-810, 810-820 and so on, using tally marks. Also, draw a histogram and answer the following questions:
(i) Which group has the maximum number of workers?
(ii) How many workers earn Rs 850 and more?
(iii) How many workers earn less than Rs 850?
Construct a frequency polygon without using a histogram for the following frequency distribution :
| Class Interval | 10-20 | 20-40 | 40-60 | 60-80 | 80-100 |
| Frequency | 9 | 17 | 15 | 20 | 14 |
Represent the following data by histogram:
| Price of sugar Per kg (in Rs) | Number of weeks |
| 28-30 | 4 |
| 30-32 | 8 |
| 32-34 | 22 |
| 34-36 | 12 |
| 36-38 | 6 |
Draw the Histogram and hence, the frequency polygon for the following frequency distribution:
| House Rent (In ₹ per month) | 400-600 | 600-800 | 800-1000 | 1000-1200 |
| Number of families | 200 | 240 | 300 | 50 |
Distribution of height in cm of 100 people is given below:
| Class interval (cm) | Frequency |
| 145 - 155 | 3 |
| 155 - 165 | 35 |
| 165 - 175 | 25 |
| 175 - 185 | 15 |
| 185 - 195 | 20 |
| 195 - 205 | 2 |
Draw a histogram to represent the above data.
Draw the histogram for the following frequency distribution and hence estimate the mode for the distribution.
| Class | Frequency |
| 0 - 5 | 2 |
| 5 - 10 | 7 |
| 10 - 15 | 18 |
| 15 - 20 | 10 |
| 20 - 25 | 8 |
| 25 - 30 | 5 |
| Total | 24 |
Draw a histogram to represent the following data:
| Pocket money in ₹ | No. of Students |
| 150 - 200 | 10 |
| 200 - 250 | 5 |
| 250 - 300 | 7 |
| 300 - 350 | 4 |
| 350 - 400 | 3 |
The marks obtained by 50 students in Mathematics are given below.
(i) Make a frequency distribution table taking a class size of 10 marks
(ii) Draw a histogram and a frequency polygon.
| 52 | 33 | 56 | 52 | 44 | 59 | 47 | 61 | 49 | 61 |
| 47 | 52 | 67 | 39 | 89 | 57 | 64 | 58 | 63 | 65 |
| 32 | 64 | 50 | 54 | 42 | 48 | 22 | 37 | 59 | 63 |
| 36 | 35 | 48 | 48 | 55 | 62 | 74 | 43 | 41 | 51 |
| 08 | 71 | 30 | 18 | 43 | 28 | 20 | 40 | 58 | 49 |
Histogram shows the number of people owning the different number of books. Answer the question based on it.

The total number of people surveyed is ______.
Histogram shows the number of people owning the different number of books. Answer the question based on it.

The number of people owning books less than 40 is ______.
In a histogram ______ are drawn with width equal to a class interval without leaving any gap in between.
The top speeds of thirty different land animals have been organised into a frequency table. Draw a histogram for the given data.
| Maximum Speed (km/h) | Frequency |
| 10 – 20 | 5 |
| 20 – 30 | 5 |
| 30 – 40 | 10 |
| 40 – 50 | 8 |
| 50 – 60 | 0 |
| 60 – 70 | 2 |
