Advertisements
Advertisements
Question
Illustrate the following results (representing the average weight of a boy at different heights) by a broken line graph.
| Height (in cm) | 70 | 75 | 80 | 85 | 90 | 95 | 100 | 105 |
| Weight in kg | 37 | 40 | 42 | 46 | 52 | 55 | 56 | 60 |
Graph
Advertisements
Solution
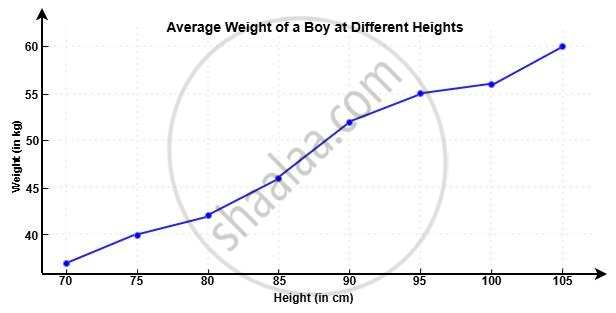
Here is the broken line graph showing the relationship between a boy’s height (in cm) and his average weight (in kg).
As height increases from 70 cm to 105 cm, weight also increases steadily from 37 kg to 60 kg.
This graph clearly shows a positive correlation between height and weight.
shaalaa.com
Is there an error in this question or solution?
