Advertisements
Advertisements
Question
Draw the PV diagram for the isochoric process.
Advertisements
Solution

APPEARS IN
RELATED QUESTIONS
What is a thermodynamic process?
When food is cooked in a vessel by keeping the lid closed, after some time the steam pushes the lid outward. By considering the steam as a thermodynamic system, then in the cooking process
Give the equation of state for an isothermal process.
Apply first law for an adiabatic process.
Consider the following cyclic process consist of isotherm, isochoric and isobar which is given in the figure.

Draw the same cyclic process qualitatively in the V-T diagram where T is taken along the x-direction and V is taken along the y-direction. Analyze the nature of heat exchange in each process.
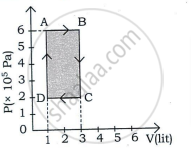
An ideal gas is taken in a cyclic process as shown in the figure. Calculate
- work done by the gas
- work done on the gas
- Net work done in the process

For a given ideal gas 6 × 10⁵ J heat energy is supplied and the volume of gas is increased from 4 m3 to 6 m3 at atmospheric pressure. Calculate
- the work done by the gas
- change in internal energy of the gas
- graph this process in PV and TV diagram
An ideal gas is made to go from a state A to stale B in the given two different ways (see figure) (i) an isobaric and then an isochoric process and (ii) an isochoric and then an isobaric process. The work done by gas in the two processes are W1 and W2 respectively. Then,

One mole of an ideal gas with `gamma` = 1.4 is adiabatically compressed so that its temperature rises from 27° C to 47° C. The change in the internal energy of the gas is (R = 8.3 J/mol.K) ____________.
An ideal gas is taken through a cyclic process ABCDA as shown in figure. The net work done by the gas during the cycle is ______.