Advertisements
Advertisements
Question
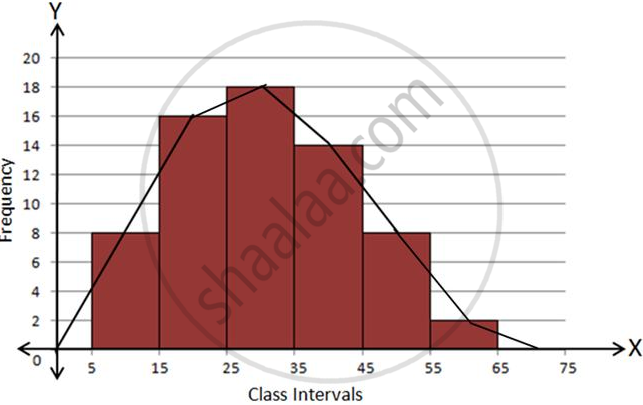
Draw frequency polygons for each of the following frequency distribution:
(a) using histogram
(b) without using histogram
|
C.I |
5 -15 | 15 -25 | 25 -35 | 35 - 45 | 45-55 | 55-65 |
| ƒ | 8 | 16 | 18 | 14 | 8 | 2 |
Advertisements
Solution
Using Histogram:
| C.I. | f |
| 5 - 15 | 8 |
| 15 - 25 | 16 |
| 25 - 35 | 18 |
| 35 - 45 | 14 |
| 45 - 55 | 8 |
| 55 - 65 | 2 |
Steps:
- Draw a histogram for the given data.
- Mark the mid-point at the top of each rectangle of the histogram drawn.
- Also, mark the mid-point of the immediately lower class-interval and mid-point of the immediately higher class-interval.
- Join the consecutive mid-points marked by straight lines to obtain the required frequency polygon.
Without using Histogram:
Steps:
- Find the class-mark (mid-value) of each given class-interval.
- On a graph paper, mark class-marks along X-axis and frequencies along Y-axis.
- On this graph paper, mark points taking values of class-marks along the X-axis and the values of their corresponding frequencies along the Y-axis.
- Draw line segments joining the consecutive points marked in step (3) above.
C.I.
Class-mark
f
-5 - 5
0
0
5 - 15
10
8
15 - 25
20
16
25 - 35
30
18
35 - 45
40
14
45 - 55
50
8
55 - 65
60
2
65 - 75
70
0

APPEARS IN
RELATED QUESTIONS
Given below (Fig. below) is the bar graph indicating the marks obtained out of 50 in mathematics paper by 100 students. Read the bar graph and answer the following questions:

(i) It is decided to distribute work books on mathematics to the students obtaining less than 20 marks, giving one workbook to each of such students. If a work book
costs Rs 5, what sum is required to buy the work books?
(ii) Every student belonging to the highest mark group is entitled to get a prize of Rs. 10. How much amount of money is required for distributing the prize money?
(iii) Every student belonging to the lowest mark—group has to solve 5 problems per day. How many problems, in all, will be solved by the students of this group per day?
(iv) State whether true or false.
a. 17% students have obtained marks ranging from 40 to 49.
b. 59 students have obtained marks ranging from 10 to 29.
(v) What is the number of students getting less than 20 marks?
(vi) What is the number of students getting more than 29 marks?
(vii) What is the number of students getting marks between 9 and 40?
(viii) What is the number of students belonging to the highest mark group?
(ix) What is the number of students obtaining more than 19 marks?
Read the following bar graph and answer the following questions:

(i) What information is given by the bar graph?
(ii) Which state is the largest producer of rice?
(iii) Which state is the largest producer of wheat?
(iv) Which state has total production of rice and wheat as its maximum?
(v) Which state has the total production of wheat and rice minimum?
The population of Delhi State in different census years is as given below:
| Census year | 1961 | 1971 | 1981 | 1991 | 2001 |
| Population in Lakhs | 30 | 55 | 70 | 110 | 150 |
The following data gives the value (in crores of rupees) of the Indian export of cotton textiles for different years:
| Years | 1982 | 1983-1984 | 1984-1985 | 1985-1986 | 1986-1987 |
| Value of Export of Cotton Textiles (in crores of rupees) |
300 | 325 | 475 | 450 | 550 |
Represent the above data with the help of a bar graph. Indicate with the help of a bar graph the year in which the rate of increase in exports is maximum over the preceding year.
Construct a histogram for the following data:
| Monthly School fee (in Rs): |
30-60 | 60-90 | 90-120 | 120-150 | 150-180 | 180-210 | 210-240 |
| No of Schools | 5 | 12 | 14 | 18 | 10 | 9 | 4 |
A frequency polygon is constructed by plotting frequency of the class interval and the
A histogram is a pictorial representation of the grouped data in which class intervals and frequency are respectively taken along
A hundred students from a certain locality use different modes of travelling to school as given below. Draw a bar graph.
| Bus | Car | Rickshaw | Bicycle | Walk |
| 32 | 16 | 24 | 20 | 8 |
In the following figure, there is a histogram depicting daily wages of workers in a factory. Construct the frequency distribution table.

Draw a histogram of the following distribution:
| Heights (in cm) | Number of students |
| 150 – 153 | 7 |
| 153 – 156 | 8 |
| 156 – 159 | 14 |
| 159 – 162 | 10 |
| 162 – 165 | 6 |
| 165 – 168 | 5 |
