Advertisements
Advertisements
Questions
Describe the graphical representation of first order reaction.
Describe the graphical method for the determination of the order of a first order reaction.
How would you represent a first order reaction graphically?
Advertisements
Solution 1
The rate constant for first order reaction is,
kt = ln `([A_0])/([A])`
kt = In [A0] – In [A]
In [A] = In [A0] – kt
y = c + mx
If we follow the reaction by measuring the concentration of the reactants at regular time intervals ‘t’, a plot of ln [A] against ‘t’ yields a straight line with a negative slope. From this, the rate constant is calculated.

A plot of ln [A] vs t for a first-order reaction, \[\ce{A -> product}\] with initial concentration of [A] = 1.00 M and k = 2.5 × 10⁻² min−1
Solution 2
A first order reaction can be represented graphically in several ways. Some important graphical representations and their characteristics are as follows.
Reaction rate vs concentration plot: The rate law for a first-order reaction is given by
Rate = k[A]

A plot of reaction rate vs concentration of reactant for a first order reaction.
The equation y = mx indicates a straight line that passes through the origin. Plotting reaction rates against reactant concentration yields a straight line that passes through the origin, as illustrated in the picture above. The slope of the line corresponds to the rate constant of the reaction.
\[\ce{Slope of the line = \frac{CB}{AC} = k}\]
Concentration vs. time plot: We know that
[A] = [A]0 e−kt

Exponential decay of the conc. of reactant as a function of time for a first order reaction.
The equation shows that a first-order process is exponential, with the concentration of reactant decreasing exponentially over time. Graphing reactant concentrations over time yields an exponential decay curve, as illustrated in the image above.
log10 [A] vs time plot: We know that
\[\ce{k = \frac{2.303}{t} log_10 \frac{[A]_0}{[A]}}\]
This equation can be written as
\[\ce{log_10 [A] = - \frac{kt}{2.303} + log_10[A]_0}\]
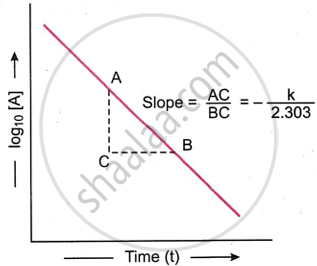
The above equation is of the type y = mx + c and represents a straight line. Therefore, on plotting log10 [A] against t, a straight line (as shown in the figure above) is obtained. The slope of the line is equal to \[\ce{\frac{-k}{2.303}}\] while the intercept of the line on log10 [A] axis is equal to log10 [A]0. Thus,
\[\ce{Slope of the line = \frac{AC}{BC} = - \frac{k}{2.303}}\]
Intercept on log10 [A] axis = log10 [A]0
Thus, the value of k can be obtained from the slope of the line.
RELATED QUESTIONS
In a first-order reaction, the concentration of the reactant decreases from 20 mmol dm−3 to 8 mmol dm−3 in 38 minutes. What is the half-life of reaction?
Identify the order for the following reaction.
Radioactive disintegration of 92U238
A first order reaction is 25% completed in 40 minutes. What is the rate constant k tor the reaction?
If [A]0 is the initial concentration, then the half life of zero order reaction is ____________.
The rate constant of a first order reaction is 3 × 10⁻⁶ per s. If the initial concentration is 0.10 mol dm−3, the initial rate of reaction is ____________.
The rate and the rate constants of the reaction, \[\ce{A + 2B -> C + D}\] are 8 × 10⁻³ mol dm−3 s−1 and 2 × 10⁻³ s−1 respectively. The concentrations of A and B are 4 mol dm−3 each. The overall order of the reaction is ____________.
A certain zero order reaction has rate constant 0.025 M s-1. What will be the concentration of reactant 'A' after 15 seconds, if initial concentration is 0.50 M?
What is the unit of rate constant for the zero order reaction?
Obtain the expression for half-life and rate constant of the first-order reaction.
Which among the following reactions is an example of pseudo first order reaction?
