Advertisements
Advertisements
प्रश्न
Describe the graphical representation of first order reaction.
Describe the graphical method for the determination of the order of a first order reaction.
How would you represent a first order reaction graphically?
Advertisements
उत्तर १
The rate constant for first order reaction is,
kt = ln `([A_0])/([A])`
kt = In [A0] – In [A]
In [A] = In [A0] – kt
y = c + mx
If we follow the reaction by measuring the concentration of the reactants at regular time intervals ‘t’, a plot of ln [A] against ‘t’ yields a straight line with a negative slope. From this, the rate constant is calculated.

A plot of ln [A] vs t for a first-order reaction, \[\ce{A -> product}\] with initial concentration of [A] = 1.00 M and k = 2.5 × 10⁻² min−1
उत्तर २
A first order reaction can be represented graphically in several ways. Some important graphical representations and their characteristics are as follows.
Reaction rate vs concentration plot: The rate law for a first-order reaction is given by
Rate = k[A]

A plot of reaction rate vs concentration of reactant for a first order reaction.
The equation y = mx indicates a straight line that passes through the origin. Plotting reaction rates against reactant concentration yields a straight line that passes through the origin, as illustrated in the picture above. The slope of the line corresponds to the rate constant of the reaction.
\[\ce{Slope of the line = \frac{CB}{AC} = k}\]
Concentration vs. time plot: We know that
[A] = [A]0 e−kt

Exponential decay of the conc. of reactant as a function of time for a first order reaction.
The equation shows that a first-order process is exponential, with the concentration of reactant decreasing exponentially over time. Graphing reactant concentrations over time yields an exponential decay curve, as illustrated in the image above.
log10 [A] vs time plot: We know that
\[\ce{k = \frac{2.303}{t} log_10 \frac{[A]_0}{[A]}}\]
This equation can be written as
\[\ce{log_10 [A] = - \frac{kt}{2.303} + log_10[A]_0}\]
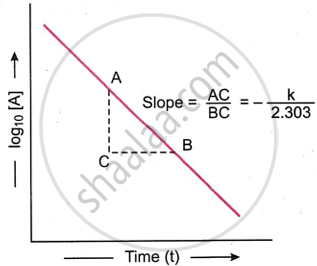
The above equation is of the type y = mx + c and represents a straight line. Therefore, on plotting log10 [A] against t, a straight line (as shown in the figure above) is obtained. The slope of the line is equal to \[\ce{\frac{-k}{2.303}}\] while the intercept of the line on log10 [A] axis is equal to log10 [A]0. Thus,
\[\ce{Slope of the line = \frac{AC}{BC} = - \frac{k}{2.303}}\]
Intercept on log10 [A] axis = log10 [A]0
Thus, the value of k can be obtained from the slope of the line.
संबंधित प्रश्न
Answer the following in brief.
Derive the integrated rate law for the first-order reaction.
Derive an integrated rate law expression for first order reaction: A → B + C
A zero-order reaction \[\ce{X -> Product}\], with an initial concentration 0.02 M has a half-life of 10 min. if one starts with concentration 0.04 M, then the half-life is
For a first order reaction \[\ce{A ->Product}\] with initial concentration x mol L−1, has a half life period of 2.5 hours. For the same reaction with initial concentration `("x"/2)` mol L−1 the half life is
A first order reaction is 25% completed in 40 minutes. What is the rate constant k tor the reaction?
A first order reaction takes 40 minutes for 30% decomposition. What is the half-life of reaction?
A first order reaction, A → B takes 100 minutes for it's 90% completion. What is the rate constant of reaction?
Which is the relation between half life and rate constant for a zero order?
A radioactive isotope decayed to 17/32 of its original mass after 60 minutes. Find the half-life of this radioisotope.
The half-life of first order reaction is 1.7 hour. What is its rate constant?
