Advertisements
Advertisements
Question
Answer the following question in about 30 words:
Discuss important steps to represent data with the help of a pie diagram.
Very Short Answer
Advertisements
Solution
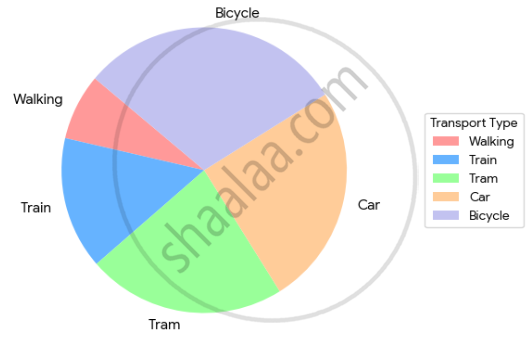
Students at an adult school were surveyed about the type of transportation they use to get to school.
Walking 3, Train 6, Tram 9, Car 10, Bicycle 12.
Total Population of Students = 40
| Transport Type | Number of Students | Percentage of students preferring transport type | Angle size for Pie Chart |
| Walking | 3 | 3 < 100 = 7.5% 40 | 7.5% of 360 27° |
| Train | 6 | 6 × 100 = 15% 40 | 15% of 360 54° |
| Tram | 9 | 9 × 100 = 22.5% 40 | 22.5% of 360 81° |
| Car | 10 | 10 × 100 25% 40 | 25% of 360 90 |
| Bicycle | 12 | 12 100 30% 40 | 30% of 360 108 |
Total Population of Students = 40
shaalaa.com
Construction of Diagrams
Is there an error in this question or solution?
Chapter 3: Graphical Representation of Data - Exercises [Page 44]
