Advertisements
Advertisements
प्रश्न
Answer the following question in about 30 words:
Discuss important steps to represent data with the help of a pie diagram.
Advertisements
उत्तर
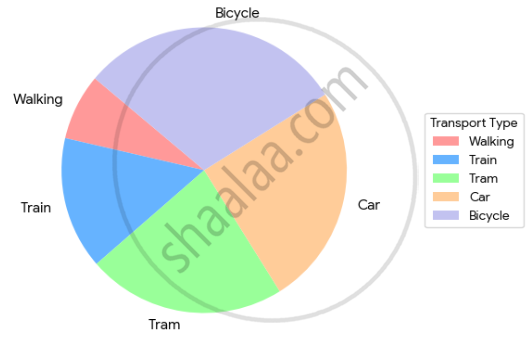
Students at an adult school were surveyed about the type of transportation they use to get to school.
Walking 3, Train 6, Tram 9, Car 10, Bicycle 12.
Total Population of Students = 40
| Transport Type | Number of Students | Percentage of students preferring transport type | Angle size for Pie Chart |
| Walking | 3 | 3 < 100 = 7.5% 40 | 7.5% of 360 27° |
| Train | 6 | 6 × 100 = 15% 40 | 15% of 360 54° |
| Tram | 9 | 9 × 100 = 22.5% 40 | 22.5% of 360 81° |
| Car | 10 | 10 × 100 25% 40 | 25% of 360 90 |
| Bicycle | 12 | 12 100 30% 40 | 30% of 360 108 |
Total Population of Students = 40
APPEARS IN
संबंधित प्रश्न
Which one of the following is best suited to represent the decadal growth of population?
Polygraph is constructed to represent ______.
Which one of the following maps is known as “Dynamic Map”?
Answer the following question in about 30 words:
What is a thematic map?
Answer the following question in about 30 words:
Differentiate between multiple bar diagram and compound bar diagram.
Answer the following question in about 30 words:
Describe the method of constructing a traffic flow map.
Represent the following data with the help of a suitable diagram.
India: Trends of Urbanisation 1901-2001
| Year | Decennial growth (%) |
| 1911 | 0.35 |
| 1921 | 8.27 |
| 1931 | 19.12 |
| 1941 | 31.97 |
| 1951 | 41.42 |
| 1961 | 26.41 |
| 1971 | 38.23 |
| 1981 | 46.14 |
| 1991 | 36.47 |
| 2001 | 31.13 |
Represent the following data with the help of a suitable diagram.
India: Literacy and Enrolment Ratio in Primary and Upper Primary Schools
| Year | Literacy Ratio | Enrolment Ratio Primary | Enrolment Ratio Upper Primary | ||||||
| Person | Male | Female | Boys | Girls | Total | Boys | Girls | Total | |
| 1950-51 | 18.3 | 27.2 | 8.86 | 60.6 | 25 | 42.6 | 20.6 | 4.6 | 12.7 |
| 1999-2000 | 65.4 | 75.8 | 54.2 | 104 | 85 | 94.9 | 67.2 | 50 | 58.8 |
Represent the following data with the help of a pie diagram.
India: Land use 1951-2001
| 1950-51 | 1998-2001 | |
| Net Sown Area | 42 | 46 |
| Forest | 14 | 22 |
| Not available for cultivation | 17 | 14 |
| Fallow Land | 10 | 8 |
| Pasture and Tree | 9 | 5 |
| Cultruable Waste Land | 8 | 5 |
Study the table given below and draw the given diagrams/maps.
| Area and Production of Rice in Major States | ||||
| States | Area in 000 ha | % to total area | Production 000 tones | % to total production |
| West Bengal | 5,435 | 12.3 | 12,428 | 14.6 |
| Uttar Pradesh | 5,839 | 13.2 | 11,540 | 13.6 |
| Andhra Pradesh | 4,028 | 9.1 | 12,428 | 13.5 |
| Punjab | 2,611 | 5.9 | 9,154 | 10.8 |
| Tamil Nadu | 2,113 | 4.8 | 7,218 | 8.5 |
| Bihar | 3,671 | 8.3 | 5,417 | 6.4 |
- Construct a multiple-bar diagram to show the area under rice in each State.
- Construct a pie diagram to show the percentage of area under rice in each State.
- Construct a dot map to show the production of rice in each State.
- Construct a Choropleth map to show the percentage of rice production in the states.
Show the following data on temperature and rainfall in Kolkata with a suitable diagram.
| Months | Temperature in º C | Rainfall in cm |
| Jan | 19.6 | 1.2 |
| Feb | 22.0 | 2.8 |
| Mar | 27.1 | 3.4 |
| Apr | 30.1 | 5.1 |
| May | 30.4 | 13.4 |
| June | 29.9 | 29.0 |
| Jul | 28.9 | 33.1 |
| Aug | 28.7 | 33.4 |
| Sep | 28.9 | 25.3 |
| Oct | 27.6 | 12.7 |
| Nov | 23.4 | 2.7 |
| Dec | 19.7 | 0.4 |
