Advertisements
Advertisements
Question
Represent the following data with the help of a suitable diagram.
India: Trends of Urbanisation 1901-2001
| Year | Decennial growth (%) |
| 1911 | 0.35 |
| 1921 | 8.27 |
| 1931 | 19.12 |
| 1941 | 31.97 |
| 1951 | 41.42 |
| 1961 | 26.41 |
| 1971 | 38.23 |
| 1981 | 46.14 |
| 1991 | 36.47 |
| 2001 | 31.13 |
Activity
Diagram
Advertisements
Solution
Range of the data = 46.14 – 0.35
= 45.79
A line graph will be the right method to present these data.
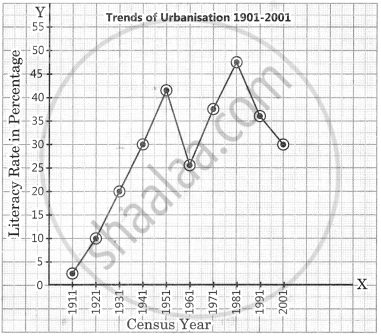
shaalaa.com
Construction of Diagrams
Is there an error in this question or solution?
Chapter 3: Graphical Representation of Data - Exercises [Page 44]
