Advertisements
Advertisements
Question
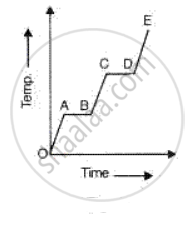
A substance is heated at a constant rate from a low temperature to a high temperature. A graph of temperature against time is shown in the figure. Which part or parts of the graph correspond(s) to the substance existing in two states?
Advertisements
Solution
APPEARS IN
RELATED QUESTIONS
The coolant in a chemical or a nuclear plant (i.e., the liquid used to prevent the different parts of a plant from getting too hot) should have high specific heat.
What do you mean by the following statement?
The heat capacity of a body is 50 JK-1?
State the effect of enhancement of green house effect.
What is heat? What is the S. I. unit of heat?
Explain, why is water sprayed on roads in evening in hot summer?
The SI unit of specific heat is _______.
Numerical Problem.
What is the heat in joules required to raise the temperature of 25 grams of water from 0°C to 100°C? What is the heat in Calories? (Specific heat of water = `(4.18"J")/("g"°"C")`
Which of the substances P, Q, or R has the lowest specific heat? The temperature v/s time graph is shown ______.

When two kilocalories of heat are supplied to a system, the internal energy of the system increases by 5030 J and the work done by the gas against the external pressure is 3350 J. Calculate J, the mechanical equivalent of heat.
A 0.2 kg metal at 150°C is placed in a copper calorimeter (water equivalent 0.025 kg) with 150 cm³ water at 27°C. Final temperature is 40°C. Find the specific heat of the metal.
