Please select a subject first
Advertisements
Advertisements
The bar graph shown in Fig 23.16 represents the circulation of newspapers in 10 languages. Study the bar graph and answer the following questions:

(i) What is the total number of newspapers published in Hindi, English, Urdu, Punjabi and Bengali?
(ii) What percent is the number of news papers published in Hindi of the total number of newspapers?
(iii) Find the excess of the number of newspapers published in English over those published in Urdu.
(iv) Name two pairs of languages which publish the same number of newspapers.
(v) State the language in which the smallest number of newspapers are published.
(vi) State the language in which the largest number of newspapers are published.
(vii) State the language in which the number of newspapers published is between 2500 and 3500.
(viii) State whether true or false:
a. The number of newspapers published in Malayalam and Marathi together is less than those published in English.
b. The number of newspapers published in Telugu is more than those published in Tamil.
Concept: undefined >> undefined
O is any point in the interior of ΔABC. Prove that
(i) AB + AC > OB + OC
(ii) AB + BC + CA > OA + QB + OC
(iii) OA + OB + OC >` 1/2`(AB + BC + CA)
Concept: undefined >> undefined
Advertisements
Read the bar graph given in Fig. 23.17 and answer the following questions:
(i) What information is given by the bar graph?
(ii) What was the crop-production of rice in 1970 - 71?
(iii) What is the difference between the maximum and minimum production of rice?

Concept: undefined >> undefined
Read the bar graph given in Fig. below and answer the following questions:

(i) What information does it give?
(ii) In which part the expenditure on education is maximum in 1980?
(iii) In which part the expenditure has gone up from 1980 to 1990?
(iv) In which part the gap between 1980 and 1990 is maximum?
Concept: undefined >> undefined
Read the bar graph given in Fig. 23.19 and answer the following questions:
(i) What information is given by the bar graph?

(ii) In which years the areas under the sugarcane crop were the maximum and the minimum?
(iii) State whether true or false:
The area under the sugarcane crop in the year 1982 - 83 is three times that of the year 1950 - 51
Concept: undefined >> undefined
Prove that the perimeter of a triangle is greater than the sum of its altitudes.
Concept: undefined >> undefined
Read the bar graph given in Fig. 23.20 and answer the fol1owing questions:

(i) What information is given by the bar graph?
(ii) What was the expenditure on health and family planning in the year 1982-83?
(iii) In which year is the increase in expenditure maximum over the expenditure in previous year? What is the maximum increase?
Concept: undefined >> undefined
Read the bar graph given in Fig. 23.21 and answer the following questions:
(i) What is the information given by the bar graph?
(ii) What is the number of families having 6 members?
(iii) How many members per family are there in the maximum number of families? Also tell the number of such families.
(iv) What are the number of members per family for which the number of families are equal? Also, tell the number of such families?
Concept: undefined >> undefined
Read the bar graph given in Fig. 23.22 and answer the following questions:

(i) What information is given by the bar graph?
(ii) Which Doordarshan centre covers maximum area? Also tell the covered area.
(iii) What is the difference between the areas covered by the centres at delhi and Bombay?
(iv) Which Doordarshan centres are in U.P State? What are the areas covered by them?
Concept: undefined >> undefined
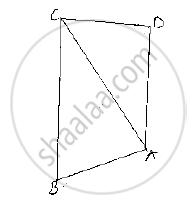
In Fig. 10.131, prove that: (i) CD + DA + AB + BC > 2AC (ii) CD + DA + AB > BC
Concept: undefined >> undefined
Explain the reading and interpretation of bar graphs.
Concept: undefined >> undefined
Which of the following statements are true (T) and which are false (F)?
Sum of the three sides of a triangle is less than the sum of its three altitudes.
Concept: undefined >> undefined
Read the following bar graph and answer the following questions:
(i) What information is given by the bar graph?
(ii) In which year the export is minimum?
(iii)In which year the import is maximum?
(iv)In which year the difference of the values of export and import is maximum?

Concept: undefined >> undefined
Which of the following statements are true (T) and which are false (F)?
Sum of any two sides of a triangle is greater than twice the median drawn to the third side.
Concept: undefined >> undefined
Which of the following statements are true (T) and which are false (F)?
Sum of any two sides of a triangle is greater than the third side.
Concept: undefined >> undefined
Which of the following statements are true (T) and which are false (F)?
Difference of any two sides of a triangle is equal to the third side.
Concept: undefined >> undefined
Which of the following statements are true (T) and which are false (F)?
If two angles of a triangle are unequal, then the greater angle has the larger side opposite to it.
Concept: undefined >> undefined
The following bar graph shows the results of an annual examination in a secondary school. Read the bar graph and choose the correct alternative in each of the following:

(i) The pair of classes in which the results of boys and girls are inversely proportional are:
(a) VI, VIII (b) VI, IX (c) VIII, IX (d) VIII, X
(ii) The class having the lowest failure rate of girls is
(a) VII (b) X (c) IX (d) VIII
(iii)The class having the lowest pass rate of students is
(a) VI (b) VII (c) VIII (d) IX
Concept: undefined >> undefined
Which of the following statements are true (T) and which are false (F)?
Of all the line segments that can be drawn from a point to a line not containing it, the perpendicular line segment is the shortest one.
Concept: undefined >> undefined
Fill in the blank to make the following statement true.
In a right triangle the hypotenuse is the .... side.
Concept: undefined >> undefined
