Advertisements
Advertisements
प्रश्न
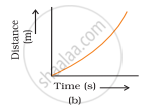
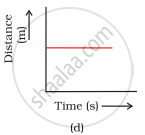
Which of the following figures (Fig. 8.3) represents uniform motion of a moving object correctly?
पर्याय

Advertisements
उत्तर
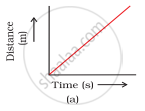
In uniform motion, object covers equal distances in equal intervals of time. Therefore, the distance-time graph must be a straight line inclined to the time axis. Hence, graph (a) is correct.
APPEARS IN
संबंधित प्रश्न
What is the Differnece between speed and velocity ?
The distance between Delhi and Agra is 200 km. A train travels the first 100 km at a speed of 50 km/h. How fast must the train travel the next 100 km, so as to average 70 km/h for the whole journey ?
A car is moving along a straight road at a steady speed. It travels 150 m in 5 seconds:
What is its average speed ?
A car is moving along a straight road at a steady speed. It travels 150 m in 5 seconds:
How far does it travel in 6 seconds ?
Which of the following statement is correct regarding velocity and speed of a moving body?
A car moving on a straight path covers a distance of 1 km due east in 100 s. What is the speed of the car?
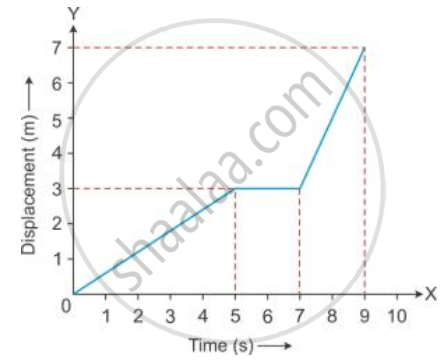
Figure shows the displacement of a body at different times .
Calculate the velocity of the body as it moves for time interval :
(i) 0 to 5 s,
(ii) 5 s to 7 s
(iii) 7 s to 9 s.
Define variable velocity and give one example.
A body projected vertically up with a velocity of 10 m/s reaches a height of 20 m. If it is projected with a velocity of 20 m/s, then the maximum height reached by the body is:
Distinguish between speed and velocity.
