Advertisements
Advertisements
प्रश्न
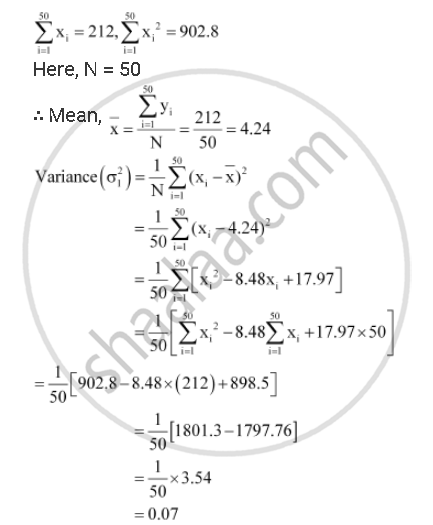
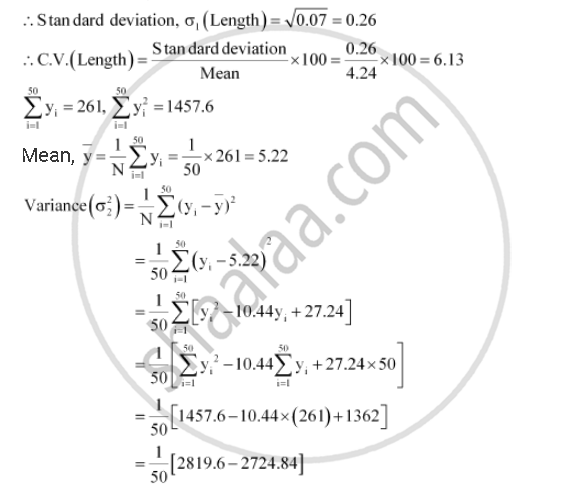
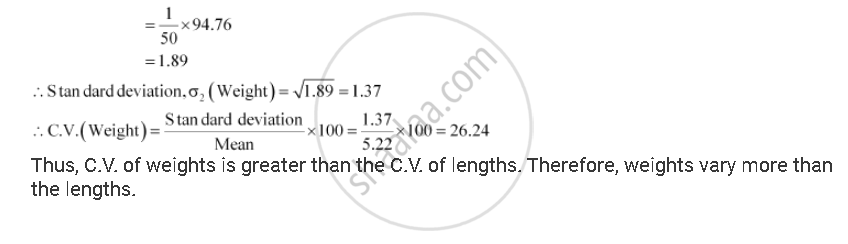
The sum and sum of squares corresponding to length x (in cm) and weight y (in gm) of 50 plant products are given below:
`sum_(i-1)^50 x_i = 212, sum_(i=1)^50 x_i^2 = 902.8, sum_(i=1)^50 y_i = 261, sum_(i = 1)^50 y_i^2 = 1457.6`
Which is more varying, the length or weight?
Advertisements
उत्तर
संबंधित प्रश्न
Find the mean and variance for the first n natural numbers.
Find the mean and variance for the first 10 multiples of 3.
The mean and variance of 7 observations are 8 and 16, respectively. If five of the observations are 2, 4, 10, 12 and 14. Find the remaining two observations.
The mean and standard deviation of 20 observations are found to be 10 and 2, respectively. On rechecking, it was found that an observation 8 was incorrect. Calculate the correct mean and standard deviation in each of the following cases:
- If wrong item is omitted.
- If it is replaced by 12.
The mean and standard deviation of a group of 100 observations were found to be 20 and 3, respectively. Later on it was found that three observations were incorrect, which were recorded as 21, 21 and 18. Find the mean and standard deviation if the incorrect observations are omitted.
Find the mean, variance and standard deviation for the data:
6, 7, 10, 12, 13, 4, 8, 12.
Find the mean, variance and standard deviation for the data:
227, 235, 255, 269, 292, 299, 312, 321, 333, 348.
Find the mean, variance and standard deviation for the data 15, 22, 27, 11, 9, 21, 14, 9.
The variance of 15 observations is 4. If each observation is increased by 9, find the variance of the resulting observations.
The mean and standard deviation of 6 observations are 8 and 4 respectively. If each observation is multiplied by 3, find the new mean and new standard deviation of the resulting observations.
The mean and standard deviation of 100 observations were calculated as 40 and 5.1 respectively by a student who took by mistake 50 instead of 40 for one observation. What are the correct mean and standard deviation?
Show that the two formulae for the standard deviation of ungrouped data
\[\sigma = \sqrt{\frac{1}{n} \sum \left( x_i - X \right)^2_{}}\] and
\[\sigma' = \sqrt{\frac{1}{n} \sum x_i^2 - X^2_{}}\] are equivalent, where \[X = \frac{1}{n}\sum_{} x_i\]
Find the standard deviation for the following data:
| x : | 3 | 8 | 13 | 18 | 23 |
| f : | 7 | 10 | 15 | 10 | 6 |
A student obtained the mean and standard deviation of 100 observations as 40 and 5.1 respectively. It was later found that one observation was wrongly copied as 50, the correct figure being 40. Find the correct mean and S.D.
The weight of coffee in 70 jars is shown in the following table:
| Weight (in grams): | 200–201 | 201–202 | 202–203 | 203–204 | 204–205 | 205–206 |
| Frequency: | 13 | 27 | 18 | 10 | 1 | 1 |
Determine the variance and standard deviation of the above distribution.
Two plants A and B of a factory show following results about the number of workers and the wages paid to them
| Plant A | Plant B | |
| No. of workers | 5000 | 6000 |
| Average monthly wages | Rs 2500 | Rs 2500 |
| Variance of distribution of wages | 81 | 100 |
In which plant A or B is there greater variability in individual wages?
The means and standard deviations of heights ans weights of 50 students of a class are as follows:
| Weights | Heights | |
| Mean | 63.2 kg | 63.2 inch |
| Standard deviation | 5.6 kg | 11.5 inch |
Which shows more variability, heights or weights?
Coefficient of variation of two distributions are 60% and 70% and their standard deviations are 21 and 16 respectively. What are their arithmetic means?
The mean and standard deviation of marks obtained by 50 students of a class in three subjects, mathematics, physics and chemistry are given below:
| Subject | Mathematics | Physics | Chemistry |
| Mean | 42 | 32 | 40.9 |
| Standard Deviation | 12 | 15 | 20 |
Which of the three subjects shows the highest variability in marks and which shows the lowest?
From the data given below state which group is more variable, G1 or G2?
| Marks | 10-20 | 20-30 | 30-40 | 40-50 | 50-60 | 60-70 | 70-80 |
| Group G1 | 9 | 17 | 32 | 33 | 40 | 10 | 9 |
| Group G2 | 10 | 20 | 30 | 25 | 43 | 15 | 7 |
Find the coefficient of variation for the following data:
| Size (in cms): | 10-15 | 15-20 | 20-25 | 25-30 | 30-35 | 35-40 |
| No. of items: | 2 | 8 | 20 | 35 | 20 | 15 |
In a series of 20 observations, 10 observations are each equal to k and each of the remaining half is equal to − k. If the standard deviation of the observations is 2, then write the value of k.
The standard deviation of the data:
| x: | 1 | a | a2 | .... | an |
| f: | nC0 | nC1 | nC2 | .... | nCn |
is
If the standard deviation of a variable X is σ, then the standard deviation of variable \[\frac{a X + b}{c}\] is
The mean of 100 observations is 50 and their standard deviation is 5. The sum of all squares of all the observations is
A set of n values x1, x2, ..., xn has standard deviation 6. The standard deviation of n values x1 + k, x2 + k, ..., xn + k will be ______.
The mean and standard deviation of some data for the time taken to complete a test are calculated with the following results:
Number of observations = 25, mean = 18.2 seconds, standard deviation = 3.25 seconds. Further, another set of 15 observations x1, x2, ..., x15, also in seconds, is now available and we have `sum_(i = 1)^15 x_i` = 279 and `sum_(i = 1)^15 x^2` = 5524. Calculate the standard derivation based on all 40 observations.
The mean and standard deviation of a set of n1 observations are `barx_1` and s1, respectively while the mean and standard deviation of another set of n2 observations are `barx_2` and s2, respectively. Show that the standard deviation of the combined set of (n1 + n2) observations is given by
S.D. = `sqrt((n_1(s_1)^2 + n_2(s_2)^2)/(n_1 + n_2) + (n_1n_2 (barx_1 - barx_2)^2)/(n_1 + n_2)^2)`
Two sets each of 20 observations, have the same standard derivation 5. The first set has a mean 17 and the second a mean 22. Determine the standard deviation of the set obtained by combining the given two sets.
If for distribution `sum(x - 5)` = 3, `sum(x - 5)^2` = 43 and total number of items is 18. Find the mean and standard deviation.
Let x1, x2, ... xn be n observations. Let wi = lxi + k for i = 1, 2, ...n, where l and k are constants. If the mean of xi’s is 48 and their standard deviation is 12, the mean of wi’s is 55 and standard deviation of wi’s is 15, the values of l and k should be ______.
The standard deviation of a data is ______ of any change in orgin, but is ______ on the change of scale.
The standard deviation is ______to the mean deviation taken from the arithmetic mean.
The mean and standard deviation of six observations are 8 and 4, respectively. If each observation is multiplied by 3, find the new mean and new standard deviation of the resulting observations.
