Advertisements
Advertisements
प्रश्न
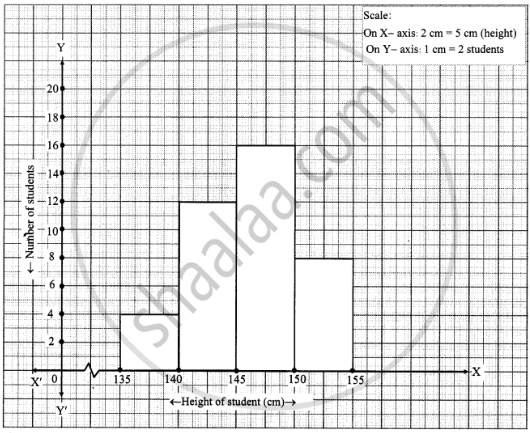
Draw a histogram of the following data.
| Height of student (cm) | 135 - 140 | 140 - 145 | 145 - 150 | 150 - 155 |
| No. of students | 4 | 12 | 16 | 8 |
Advertisements
उत्तर
APPEARS IN
संबंधित प्रश्न
Given below is the frequency distribution of driving speeds (in km/hour) of the vehicles of 400 college students:
| Speed (in km/hr) | No. of Students |
| 20-30 | 6 |
| 30-40 | 80 |
| 40-50 | 156 |
| 50-60 | 98 |
60-70 |
60 |
Draw Histogram and hence the frequency polygon for the above data.
Represent the following data by Histogram:
|
Price of Sugar per kg (in Rs.) |
Number of Weeks |
| 18-20 | 4 |
| 20-22 | 8 |
| 22-24 | 22 |
| 24-26 | 12 |
| 26-28 | 8 |
| 28-30 | 6 |
The following is the frequency distribution of waiting time at ATM centre; draw histogram to represent the data:
| Waiting time (in seconds) |
Number of Customers |
| 0 -30 | 15 |
| 30 - 60 | 23 |
| 60 - 90 | 64 |
| 90 - 120 | 50 |
| 120 - 150 | 5 |
Draw a histogram for the frequency table made for the data in Question 3 and answer the following questions.
(1) Which group has the maximum number of workers?
(2) How many workers earn Rs 850 and more?
(3) How many workers earn less than Rs 850?
The histogram below represents the scores obtained by 25 students in a mathematics mental test. Use the data to:
- Frame a frequency distribution table.
- To calculate mean.
- To determine the Modal class.

The age groups and the number of persons in the age groups, who donated blood in blood donation camp is given below. Find the measures of central angles to show the information by a pie diagram.
| Age group (Years) | 20-25 | 25-30 | 30-35 | 35-40 |
| No of persons | 80 | 60 | 35 | 25 |
Number of workshops organized by a school in different areas during the last five years are as follows:
| Years | No. of workshops |
| 1995−1996 | 25 |
| 1996−1997 | 30 |
| 1997−1998 | 42 |
| 1998−1999 | 50 |
| 1999−2000 | 65 |
Draw a histogram representing the above data.
The following histogram shows the monthly wages (in Rs) of workers in a factory:
(i) In which wage-group the largest number of workers are being kept? What is their number?
(ii) What wages are the least number of workers getting? What is the number of such workers?
(iii) What is the total number of workers?
(iv) What is the factory size?
Find the lower quartile, the upper quartile, the interquartile range and the semi-interquartile range for the following frequency distributions:
| Shoe size | 5 | 6 | 7 | 8 | 9 | 10 | 11 |
| Frequency | 8 | 1 | 7 | 14 | 11 | 5 | 4 |
Construct a frequency polygon without using a histogram for the following frequency distribution :
| Class Interval | 1-10 | 11-20 | 21-30 | 31-40 | 41-50 |
| Frequency | 8 | 12 | 10 | 16 | 6 |
The marks scored by students in Mathematics in a certain examination are given below :
| Marks Scored | Number of Students |
| 0 - 20 | 6 |
| 20 - 40 | 9 |
| 40 - 60 | 14 |
| 60 - 80 | 16 |
| 80 - 100 | 5 |
Draw histogram for the above data.
Draw the histogram for the following frequency distribution and hence estimate the mode for the distribution.
| Class | Frequency |
| 0 - 5 | 2 |
| 5 - 10 | 7 |
| 10 - 15 | 18 |
| 15 - 20 | 10 |
| 20 - 25 | 8 |
| 25 - 30 | 5 |
| Total | 24 |
Draw a histogram to represent the following data:
| Pocket money in ₹ | No. of Students |
| 150 - 200 | 10 |
| 200 - 250 | 5 |
| 250 - 300 | 7 |
| 300 - 350 | 4 |
| 350 - 400 | 3 |
The total area of the histogram is _________ to the total frequency of the given data
The graphical representation of grouped data is _________
Represent the following data by histogram:
| Price of Sugar (per kg in ₹) | Number of Weeks |
| 18 – 20 | 4 |
| 20 – 22 | 8 |
| 22 – 24 | 22 |
| 24 – 26 | 12 |
| 26 – 28 | 6 |
| 28 – 30 | 8 |
In a histogram ______ are drawn with width equal to a class interval without leaving any gap in between.
The following pictorial representation of data is a histogram.

The following histogram shows the frequency distribution of teaching experiences of 30 teachers in various schools:

- What is the class width?
- How many teachers are having the maximum teaching experience and how many have the least teaching experience?
- How many teachers have teaching experience of 10 to 20 years?
