Advertisements
Chapters
2: Compound Interest
3: Expansions
4: Factorisation
5: Simultaneous Linear Equations
6: Indices/Exponents
7: Logarithms
8: Triangles
9: Mid-point Theorem
10: Pythagoras Theorem
11: Rectilinear Figures
12: Constructions of Polygons
13: Theorems on Area
14: Circles
▶ 15: Statistics
16: Mensuration
17: Trigonometric Ratios
18: Trigonometric Ratios of Some Standard Angles and Complementary Angles
19: Co-ordinate Geometry: An Introduction
![Nootan solutions for मैथमैटिक्स [अंग्रेजी] कक्षा ९ आईसीएसई chapter 15 - Statistics - Shaalaa.com](/images/mathematics-english-class-9-icse_6:f26eb985e8254aa987299226050d7c71.jpg "Nootan solutions for मैथमैटिक्स [अंग्रेजी] कक्षा ९ आईसीएसई chapter 15 - Statistics")
Advertisements
Solutions for Chapter 15: Statistics
Below listed, you can find solutions for Chapter 15 of CISCE Nootan for मैथमैटिक्स [अंग्रेजी] कक्षा ९ आईसीएसई.
Nootan solutions for मैथमैटिक्स [अंग्रेजी] कक्षा ९ आईसीएसई 15 Statistics Exercise 15A [Pages 288 - 289]
Following data gives the number of children in 40 families. Represent them in the form of a frequency table.
1, 2, 6, 5, 1, 5, 1, 3, 2, 6, 2, 3, 4, 2, 0, 4, 4, 3, 2, 2, 0, 0, 1, 2, 2, 4, 3, 2, 1, 0, 5, 1, 2, 4, 3, 4, 1, 6, 2, 2
The marks obtained by 40 students of a class in an examination are given below. Present the data in the form of a frequency distribution using equal class-size, one such class being 10 – 15 (15 not included).
15, 23, 6, 23, 8, 17, 16, 8, 16, 10, 7, 5, 2, 18, 7, 12, 10, 3, 20, 3, 20, 13, 1, 21, 13, 3, 23, 16, 13, 18, 12, 5, 24, 9, 2, 7, 18, 23, 4, 12
Construct a frequency table for the following ages (in years) of 30 students using equal class-intervals, one of them being 9 – 12, where 12 is not included.
18, 12, 7, 6, 11, 15, 21, 9, 8, 13, 15, 17, 22, 19, 14, 21, 23, 8, 12, 16, 11, 21, 9, 16, 22, 23, 18, 6, 15, 17
The weights (in grams) of 40 bananas picked at random from a basket are as follows:
84, 45, 30, 110, 75, 100, 40, 70, 60, 70, 75, 40, 100, 65, 60, 95, 85, 80, 70, 45, 35, 30, 55, 70, 110, 80, 75, 85, 70, 85, 75, 90, 30, 100, 55, 45, 65, 60, 50, 40.
Construct a cumulative frequency distribution table.
The monthly wages of 30 workers in a factory are given below:
832, 860, 820, 890, 898, 845, 869, 836, 835, 810, 890, 835, 830, 833, 855, 845, 804, 808, 812, 840, 885, 835, 836, 878, 840, 868, 890, 840, 806, 890.
Represent the data in the form of a frequency distribution with class interval 10.
The water bills (in ₹) of 25 houses in a certain locality for the period from January 1998 to March 1998 are given below:
56, 8, 5, 18, 10, 44, 50, 30, 47, 36, 25, 16, 14, 22, 20, 22, 30, 24, 15, 12, 27, 42, 45, 25, 24.
Construct a frequency table and cumulative frequency table.
Construct a frequency table with equal class intervals from the following data on the monthly wages (in rupees) of 28 labourers working in a factory, taking one of the class intervals as 210-230 (230 not included).
319, 320, 300, 290, 311, 242, 272, 220, 268, 258, 242, 210, 268, 215, 306, 316, 280, 240, 210, 278, 254, 304, 302, 318, 306, 292, 236, 256.
Following are the ages of 360 patients getting medical treatment in a nursing home on a day.
| Ages (in years) | 10 – 20 | 20 – 30 | 30 – 40 | 40 – 50 | 50 – 60 | 60 – 70 |
| No. of patients | 90 | 50 | 60 | 80 | 50 | 30 |
From the following frequency distribution, obtain the (i) ‘less than’ series and (ii) ‘more than’ series.
| Marks obtained | 0 – 10 | 10 – 20 | 20 – 30 | 30 – 40 | 40 – 50 |
| Number of students | 7 | 11 | 9 | 25 | 8 |
Make a frequency table from the following:
| Marks obtained | More than 100 | More than 90 | More than 80 | More than 70 | More than 60 | More than 50 | More than 40 | More than 30 | More than 20 | More than 10 | More than 0 |
| Number of students | 0 | 2 | 15 | 30 | 48 | 59 | 71 | 78 | 82 | 88 | 90 |
The table given below shows the frequency distribution of the monthly wages of the employees of a company:
| Wages (in ₹) | 400 – 499 | 500 – 599 | 600 – 699 | 700 – 799 | 800 – 899 |
| No. of employees | 12 | 17 | 13 | 8 | 3 |
Use this table and find:
- The lower limit of the fourth class;
- The upper limit of the fifth class;
- The class boundaries of second class;
- The class mark of first class;
- The class-size of third class.
Given below is a cumulative frequency distribution table:
| Mark | Below 10 | Below 20 | Below 30 | Below 40 | Below 50 | Below 60 |
| Number of students | 17 | 22 | 29 | 37 | 50 | 60 |
Extract a frequency table from the above.
The class marks of a frequency distribution are 5, 10, 15, 20, 25, 30; find the class intervals.
The class marks of a frequency distribution are 10, 20, 30, 40, 50; find the class size and class intervals.
Construct the grouped frequency table from the following:
| Class marks | 15 | 25 | 35 | 45 | 55 | 65 |
| Frequencу | 7 | 12 | 18 | 22 | 16 | 5 |
The ages of 80 students (above 8 years) of a school are measured and tabulated as below:
| Age (in years) | 8 – 10 | below 12 | below 14 | below 16 | below 18 |
| Number of students | 7 | 15 | 29 | 68 | 80 |
Construct a frequency distribution table for the above data. Also, answer the following questions:
- How many students have at least 16 years age but less than 18 years?
- How many students have at most 14 years age?
Nootan solutions for मैथमैटिक्स [अंग्रेजी] कक्षा ९ आईसीएसई 15 Statistics Exercise 15B [Pages 296 - 299]
Draw a bar graph to illustrate the following:
| Transport to school | Walk | Bus | Bicycle | Car |
| Number of children | 10 | 12 | 18 | 8 |
Percentage of passes of a certain school at the I.C.S.E. examination for five consecutive years.
| Year | 1994 | 1995 | 1996 | 1997 | 1998 |
| % on passes | 96 | 100 | 98 | 85 | 92 |
Draw bar graph to represent the data.
Draw bar graph to represent the survey of favourite colours among 32 girls:
| Colour | Red | Orange | Yellow | Green | Blue | Indigo | Violet |
| Number of girls | 7 | 5 | 3 | 5 | 7 | 1 | 4 |
The number of visitors to an exhibition organised by a school are:
| Day | 1st | 2nd | 3rd | 4th | 5th | 6th | 7th |
| Number of visitors | 600 | 480 | 510 | 630 | 560 | 580 | 500 |
Represent the data by a bar graph.
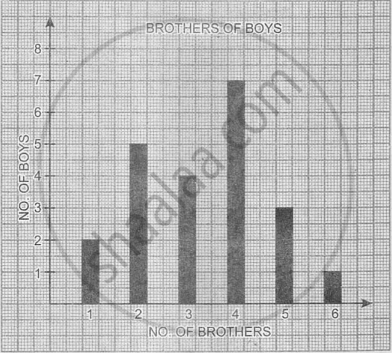
Figure illustrates the information collected about the number of brothers of the boys in a certain group. What is the total number of boys in this group.
Draw a bar chart to represent the following data:
| Name of the animals | Goat | Horse | Cow | Camel | Elephant |
| Age (in years) | 12 | 15 | 15 | 26 | 60 |
The following table shows the market position of different brands of Talcum Powders.
| Brand | A | B | C | Others |
| % Buyers | 50 | 25 | 15 | 10 |
Draw a bar graph.
The number of bags of rice sold by a shop on a certain week was as follows:
| Week days | Monday | Tuesday | Wednesday | Thursday | Friday | Saturday |
| Rice bags sold | 74 | 86 | 78 | 61 | 72 | 97 |
Draw a bar chart for this data.
Following table shows the number of boys and girls in four sections of class IX in a school. Represent them by a bar graph.
| Section | A | B | C | D |
| No. of boys | 30 | 40 | 35 | 40 |
| No. of girls | 25 | 30 | 50 | 45 |
The following table gives the number of first divisions obtained in various years by the students of a particular school. Illustrate them by a broken line graph.
| Year | 92-93 | 93-94 | 94-95 | 95-96 | 96-97 | 97-98 |
| No. of first divisions | 35 | 30 | 45 | 40 | 27 | 50 |
The following table gives the relation (obtained experimentally) between the time-period and the effective length of a pendulum. Illustrate the result by a broken line graph.
| Time-period (in sec) | 0.6 | 0.8 | 1.2 | 1.4 | 1.6 | 2.0 |
| Effective length (in cm) | 10 | 15 | 235 | 50 | 70 | 90 |
Illustrate the following results (representing the average weight of a boy at different heights) by a broken line graph.
| Height (in cm) | 70 | 75 | 80 | 85 | 90 | 95 | 100 | 105 |
| Weight in kg | 37 | 40 | 42 | 46 | 52 | 55 | 56 | 60 |
Represent the following distribution of ages (in years) of 35 teachers in a school by means of a histogram:
| Age (in years) | 25 – 30 | 30 – 35 | 35 – 40 | 40 – 45 | 45 – 50 |
| Number of teachers | 12 | 11 | 8 | 1 | 3 |
Draw a histogram for daily earnings of 20 drug stores given in the following data:
| Daily earnings: (in ₹) | 150 – 200 | 200 – 250 | 250 – 300 | 300 – 350 |
| Number of stores | 14 | 9 | 3 | 4 |
Draw a histogram for the following distribution:
| Money earned (in ₹) | 0 – 20 | 20 – 40 | 40 – 60 | 60 – 80 | 80 – 100 | 100 –120 | 120 –140 |
| No. of students | 4 | 18 | 22 | 14 | 10 | 8 | 4 |
For following distribution, draw a histogram:
| Class | 1 – 10 | 11 – 20 | 21 – 30 | 31 – 40 | 41 – 50 | 51 – 60 |
| Frequency | 7 | 3 | 5 | 2 | 6 | 4 |
Given below are the marks obtained by 40 students in an examination:
| 29 | 45 | 23 | 30 | 40 | 11 | 48 | 01 | 15 | 35 |
| 40 | 03 | 12 | 48 | 49 | 18 | 30 | 24 | 25 | 29 |
| 31 | 32 | 25 | 22 | 27 | 41 | 12 | 13 | 02 | 44 |
| 07 | 43 | 09 | 49 | 19 | 13 | 32 | 39 | 25 | 03 |
Taking class intervals 1 – 10, 11 – 20, ..., 41 – 50, make a frequency table for the above distributions and draw a histogram to represent it.
In a class of 60 boys, the marks obtained in a monthly test were as under:
| Marks | 10 – 20 | 20 – 30 | 30 – 40 | 40 – 50 | 50 – 60 |
| Students | 10 | 25 | 12 | 08 | 05 |
Draw a frequency polygon to represent the above data.
Draw a frequency polygon for the following frequency distribution:
| Class interval | 0 – 10 | 10 – 20 | 20 – 30 | 30 – 40 | 40 – 50 | 50 – 60 | 60 – 70 | 70 – 80 |
| Frequencу | 5 | 7 | 7 | 8 | 10 | 11 | 12 | 8 |
Draw a histogram and frequency polygon from the following data:
| Class interval | 20 – 25 | 25 – 30 | 30 – 35 | 35 – 40 | 40 – 45 | 45 – 50 |
| Frequencу | 24 | 30 | 52 | 46 | 28 | 10 |
Represent the following frequency distribution by a frequency polygon:
| Scores | 20 – 29 | 30 – 39 | 40 – 49 | 50 – 59 | 60 – 69 | 70 – 79 | 80 – 89 | 90 – 99 |
| Frequencу | 1 | 1 | 3 | 14 | 29 | 22 | 12 | 2 |
Construct a frequency polygon from the following data:
| Scores | 32 – 34 | 35 – 37 | 38 – 40 | 41 – 43 | 44 – 46 | 47 – 49 |
| Frequencу | 13 | 12 | 20 | 18 | 15 | 10 |
The data given below represent the marks obtained by 35 students.
| 21 | 26 | 21 | 20 | 23 | 24 | 22 | 19 | 24 |
| 26 | 25 | 23 | 26 | 29 | 21 | 24 | 19 | 25 |
| 26 | 25 | 22 | 25 | 23 | 27 | 26 | 24 | 25 |
| 30 | 25 | 23 | 27 | 28 | 24 | 28 | 28 |
Taking class intervals 19 – 20, 21 – 22, etc., make a frequency distribution for the above data. Then construct a combined histogram and frequency polygon for the distribution.
The number of match sticks in 40 boxes, on counting was found as given below:
| 44 | 41 | 42 | 43 | 47 | 50 | 51 | 49 | 43 | 42 |
| 40 | 42 | 44 | 45 | 49 | 42 | 46 | 49 | 45 | 49 |
| 45 | 47 | 48 | 43 | 43 | 44 | 48 | 43 | 46 | 50 |
| 43 | 52 | 46 | 49 | 52 | 51 | 47 | 43 | 43 | 45 |
Taking classes 40 – 41, 42 – 43 etc., construct the frequency distribution table for the above data. Draw a histogram represent the above distribution.
Nootan solutions for मैथमैटिक्स [अंग्रेजी] कक्षा ९ आईसीएसई 15 Statistics Exercise 15C [Page 303]
Find the mean of the following:
22, 26, 35, 42, 45
Find the mean of the following:
First 8 odd prime numbers
Find the mean of the following:
Factors of 48
Find the mean of the following:
Odd numbers lying between 20 and 30
Find the mean of the following:
Even numbers lying between 11 and 31
The mean of 13, 17, x, 16, 20, 26 is 23. Find the value of x.
The mean of 72, 78, 82, х, 75, 80, 72 is 77. Find the value of x.
The mean of 6 observations is 25 and the mean of other 4 observations is 20. Find the mean of all observations.
The mean of 30 observations is 60. The mean of first 20 observations is 65. Find the mean of last 10 observations.
Find the mean of 12, 17, 31, 25, 15. Find the resulting mean if observation is increased by 2.
Find the mean of 12, 17, 31, 25, 15. Find the resulting mean if observations is decreased by 2.
Find the mean of 12, 17, 31, 25, 15. Find the resulting mean if observations is multiplied by 2.
Find the mean of 12, 17, 31, 25, 15. Find the resulting mean if observations is divided by 2.
The mean of 9 observations is 15. The mean of first 5 observations is 16 and the mean of last 5 observations is 14. Find the 5th observation.
The mean of 11 observations is 12. The mean of first 6 observations is 14 and the mean of last 6 observations is 11. Find the 6th observation.
The mean of 15 observations is 40. It was detected that one observation 47 was misread as 77. Find the correct mean.
The mean of 20 observations is 32. It was detected that one observation 43 was wrongly copied as 33. Find the correct mean.
The mean of 10 observations is 72. It was found that two observations 65 and 85 were misread as 56 and 58. Find the correct mean.
The mean of 12 observations is 45. It was found that two observations 38 and 52 were misread as 28 and 32. Find the correct mean.
A batsman has a mean score of 73 in 19 innings. Find how many runs are to be scored by him in 20th inning so that his mean score becomes 75?
The mean monthly salary of 9 employees of an office is ₹ 72,000. When the salary of the manager is included, their mean becomes ₹ 80,000. Find the salary of the manager.
The mean of 11 observations is 28. It was found that one observation 34 was misread as 23. Find the mean if:
- this observation is excluded.
- correct observation is included.
The mean of 9 observations is 32. It was found that one observation 36 was misread as 63. Find the mean if:
- this observation is excluded.
- correct observation is included.
If x is the mean of n observations x1, x2, x3, ... xn, then prove that `sum_(i = 1)^n (x_i - barx) = 0`.
Find the median:
27, 32, 24, 26, 11, 14, 19
Find the median:
7, 14, 21, 15, 19, 18, 6, 10, 14
Find the median:
3, 4, 12, 13, 18, 20, 7, 8
Find the median:
28, 30, 35, 31, 27, 46, 32, 44, 33, 25
Find the median of first 7 even natural numbers.
Find the median of first 10 prime numbers.
If 12, 16, 18, x + 2, x + 4, 45, 48, 52 are arranged in ascending order and their median is 31, find the value of x.
Nootan solutions for मैथमैटिक्स [अंग्रेजी] कक्षा ९ आईसीएसई 15 Statistics Exercise 15D [Page 304]
Multiple Choice Questions Choose the correct answer from the given four options in each of the following questions:
The class-mark of the class-interval 40 – 48 is ______.
40
42
44
48
For the data 30, 36, 26, 42, 31, 49, 33, 42, 38, the range is ______.
19
23
26
49
Which of the following is not the graphical representation of data?
Bar graph
Histogram
Frequency polygon
Median
In a frequency distribution, the mid-value of a class is 12 and the class-size is 20. The lower limit of the class is ______.
2
8
10
12
The mean of first 7 odd natural numbers is ______.
5
7
8
10
In the class intervals 20 – 25, 25 – 30, 30 – 35, the number 30 is included in the class:
20 – 25
25 – 30
30 – 35
none of these
The mean of first 8 odd prime number is ______.
11.75
12
12.25
12.50
The mean of 25 observations is 32. If each observation is increased by 5, the new mean will be:
27
37
32
30
The median of the data 17, 19, 32, 24, 18, 8, 12 is ______.
12
17
19
18
The median of the data 6, 12, 25, 16, 4, 19, 10, 27 is ______.
12
14
16
19
The mean of 20 observations is 30. If the mean of 15 observations is 32, then the mean of last 5 observations is ______.
24
23
22
20
A cricketer has a mean score of 48 runs in 5 innings. The run scored by him in 6th inning to raise his mean score to 50, will be:
42
50
56
60
The numbers 12, 14, 22, 26, x, x + 2, 38, 45, 49, 51 are in ascending order. Their median is 34. The value of x is ______.
31
33
34
36
The class marks of a frequency distribution are 5, 10, 15, 20, 25, 30. The class corresponding to class mark 20 is ______.
17.5 – 22.5
17 – 23
15 – 25
none of these
Solutions for 15: Statistics
Nootan solutions for मैथमैटिक्स [अंग्रेजी] कक्षा ९ आईसीएसई chapter 15 - Statistics
Shaalaa.com has the CISCE Mathematics मैथमैटिक्स [अंग्रेजी] कक्षा ९ आईसीएसई CISCE solutions in a manner that help students grasp basic concepts better and faster. The detailed, step-by-step solutions will help you understand the concepts better and clarify any confusion. Nootan solutions for Mathematics मैथमैटिक्स [अंग्रेजी] कक्षा ९ आईसीएसई CISCE 15 (Statistics) include all questions with answers and detailed explanations. This will clear students' doubts about questions and improve their application skills while preparing for board exams.
Further, we at Shaalaa.com provide such solutions so students can prepare for written exams. Nootan textbook solutions can be a core help for self-study and provide excellent self-help guidance for students.
Concepts covered in मैथमैटिक्स [अंग्रेजी] कक्षा ९ आईसीएसई chapter 15 Statistics are .
Using Nootan मैथमैटिक्स [अंग्रेजी] कक्षा ९ आईसीएसई solutions Statistics exercise by students is an easy way to prepare for the exams, as they involve solutions arranged chapter-wise and also page-wise. The questions involved in Nootan Solutions are essential questions that can be asked in the final exam. Maximum CISCE मैथमैटिक्स [अंग्रेजी] कक्षा ९ आईसीएसई students prefer Nootan Textbook Solutions to score more in exams.
Get the free view of Chapter 15, Statistics मैथमैटिक्स [अंग्रेजी] कक्षा ९ आईसीएसई additional questions for Mathematics मैथमैटिक्स [अंग्रेजी] कक्षा ९ आईसीएसई CISCE, and you can use Shaalaa.com to keep it handy for your exam preparation.
