Advertisements
Advertisements
प्रश्न
Draw bar graph to represent the survey of favourite colours among 32 girls:
| Colour | Red | Orange | Yellow | Green | Blue | Indigo | Violet |
| Number of girls | 7 | 5 | 3 | 5 | 7 | 1 | 4 |
आलेख
Advertisements
उत्तर
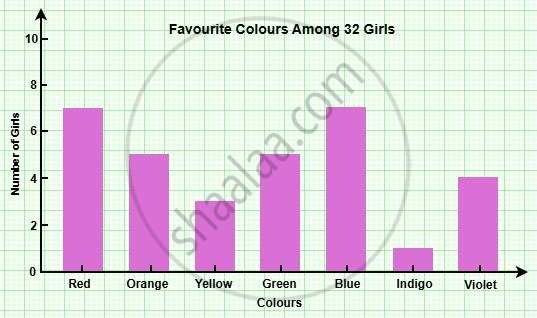
Here is the bar graph representing the survey of favourite colours among 32 girls. Each bar shows how many girls prefer a particular colour, with Red and Blue being the most popular choices and Indigo the least.
shaalaa.com
क्या इस प्रश्न या उत्तर में कोई त्रुटि है?
