Advertisements
Advertisements
प्रश्न
Given below are the marks obtained by 40 students in an examination:
| 29 | 45 | 23 | 30 | 40 | 11 | 48 | 01 | 15 | 35 |
| 40 | 03 | 12 | 48 | 49 | 18 | 30 | 24 | 25 | 29 |
| 31 | 32 | 25 | 22 | 27 | 41 | 12 | 13 | 02 | 44 |
| 07 | 43 | 09 | 49 | 19 | 13 | 32 | 39 | 25 | 03 |
Taking class intervals 1 – 10, 11 – 20, ..., 41 – 50, make a frequency table for the above distributions and draw a histogram to represent it.
आलेख
Advertisements
उत्तर
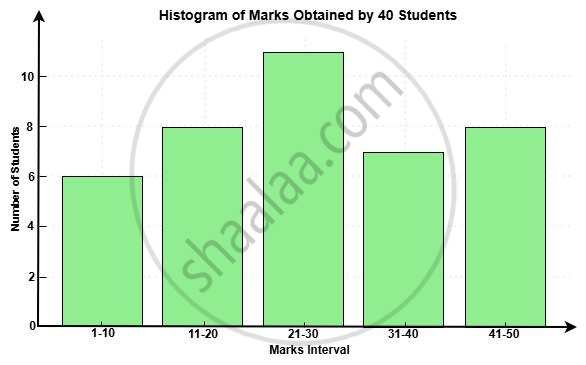
Here is the histogram representing the marks obtained by 40 students. Each bar shows how many students scored within each class interval:
1 – 10: 6 students
11 – 20: 8 students
21 – 30: 11 students
31 – 40: 7 students
41 – 50: 8 students
shaalaa.com
क्या इस प्रश्न या उत्तर में कोई त्रुटि है?
