Advertisements
Advertisements
प्रश्न
Following table shows the number of boys and girls in four sections of class IX in a school. Represent them by a bar graph.
| Section | A | B | C | D |
| No. of boys | 30 | 40 | 35 | 40 |
| No. of girls | 25 | 30 | 50 | 45 |
आलेख
Advertisements
उत्तर
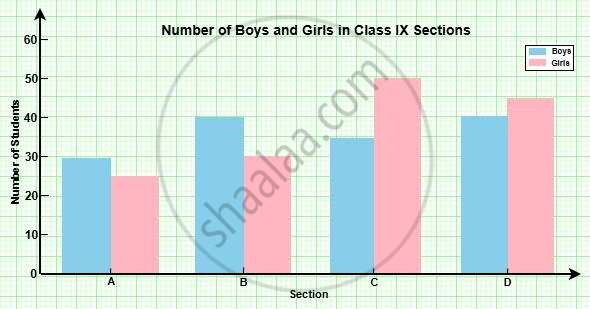
Here is the bar graph representing the number of boys and girls in four sections A, B, C, D of Class IX.
Section C has the highest number of girls 50.
Section B and D have the most boys 40 each.
This grouped bar chart helps visually compare gender distribution across sections.
shaalaa.com
क्या इस प्रश्न या उत्तर में कोई त्रुटि है?
