Please select a subject first
Advertisements
Advertisements
The following table shows the number of Maruti cars sold by five dealers in a particular month:
| Dealer: | Saya | Bagga Links | D.D. Motors | Bhasin Motors | Competent |
| Cars sold: | 60 | 40 | 20 | 15 | 10 |
Represent the above information by a pictograph.
Concept: undefined >> undefined
The population of Delhi State in different census years is as given below:
| Census year | 1961 | 1971 | 1981 | 1991 | 2001 |
| Population in Lakhs | 30 | 55 | 70 | 110 | 150 |
Concept: undefined >> undefined
Advertisements
The following data gives the number (in thousands) of applicants registered with an
| Year | 1995 | 1996 | 1997 | 1998 | 1999 | 2000 |
| Number of applicants registered (in thousands) | 18 | 20 | 24 | 28 | 30 | 34 |
Construct a bar graph to represent the above data.
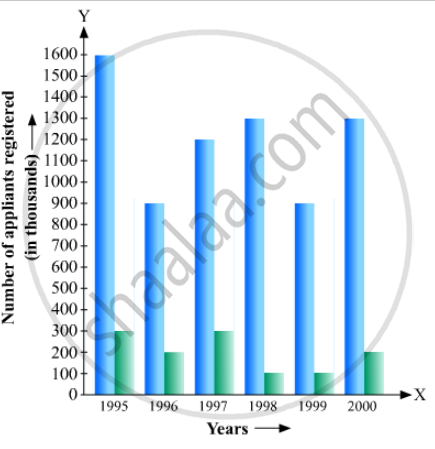
Concept: undefined >> undefined
The production of saleable steel in some of the steel plants our country during 1999 is given below:
| Plant | Bhilai | Durgapur | Rourkela | Bokaro |
| Production (In thousand tonnes) |
160 | 80 | 200 | 150 |
Construct a bar graph to represent the above data on a graph paper by using the scale 1 big divisions = 20 thousand tonnes.
Concept: undefined >> undefined
The following table gives the route length (in thousand kilometres) of the Indian Railways in some of the years:
| Year | 1960-61 | 1970-71 | 1980-81 | 1990-91 | 2000-2001 |
| Route length (in thousand km) |
56 | 60 | 61 | 74 | 98 |
Represent the above data with the help of a bar graph.
Concept: undefined >> undefined
The following data gives the amount of loans (in crores of rupees) disbursed by a bank during some years:
| Year | 1992 | 1993 | 1994 | 1995 | 1996 |
| Loan (in crores of rupees) |
28 | 33 | 55 | 55 | 80 |
(i) Represent the above data with the help of a bar graph.
(ii) With the help of the bar graph, indicate the year in which amount of loan is not increased over that of the preceding year.
Concept: undefined >> undefined
The following table shows the interest paid by a company (in lakhs):
| Year | 1995-96 | 1996-97 | 1997-98 | 1998-99 | 1999-2000 |
| Interest (in lakhs of rupees | 20 | 25 | 15 | 18 | 30 |
Draw the bar graph to represent the above information.
Concept: undefined >> undefined
The following data shows the average age of men in various countries in a certain year:
| Country | India | Nepal | China | Pakistan | U.K | U.S.A |
| Average age (in years) |
55 | 52 | 60 | 50 | 70 | 75 |
Represent the above information by a bar graph.
Concept: undefined >> undefined
The following data gives the production of foodgrains (in thousand tonnes) for some years:
| Year | 1995 | 1996 | 1997 | 1998 | 1999 | 2000 |
| Production (in thousand tonnes |
120 | 150 | 140 | 180 | 170 | 190 |
Represent the above with the help of a bar graph.
Concept: undefined >> undefined
The following data gives the amount of manure (in thousand tonnes) manufactured by a company during some years:
| Year | 1992 | 1993 | 1994 | 1995 | 1996 | 1997 |
| Manure (in thousand tonnes) |
15 | 35 | 45 | 30 | 40 | 20 |
(i) Represent the above data with the help of a bar graph.
(ii) Indicate with the help of the bar graph the year in which the amount of manufactured by the company was maximum.
(iii) Choose the correct alternative:
The consecutive years during which there was maximum decrease in manure production are:
(a) 1994 and 1995
(b) 1992 and 1993
(c) 1996 and 1997
(d) 1995 and 1996
Concept: undefined >> undefined
The following data gives the demand estimates of the Government of India, Department of Electronics for the personnel in the Computer sector during the Eighth Plan period (1990-95):
| Qualifications: | MCA (Master in Computer applications) |
DCA (Diploma in Computer Applications) |
DCE (Diploma in Computer Engineering) |
CL (Certificate Level Course) |
ST (Short-term Course) |
| Personnel Required | 40600 | 181600 | 18600 | 670600 | 1802900 |
Represent the data with the help of a bar graph. Indicate with the help of the bar graph the course where estimated requirement is least.
Concept: undefined >> undefined
The income and expenditure for 5 years of a family is given in the following data:
| Years | 1995-96 | 1996-97 | 1997-98 | 1998-99 | 1999-2000 |
| Income (Rs. inthousands) |
100 | 140 | 150 | 170 | 210 |
| Expenditure (Rs. in thousands) |
80 | 130 | 145 | 160 | 190 |
Represent the above data by a gar graph.
Concept: undefined >> undefined
The investment (in ten crores of rupees) of Life Insurance Corporation of India in different sectors are given below:
| Sectors | Investment (in ten crores of rupees) |
| Central Government Securities State Government Securities Securities guaranteed by the Government Private Sectors Socially oriented sectors (Plans) Socially oriented sectors (Non-Plan) |
45 11 23 18 46 11 |
Represent the above data with the help of bar graph.
Concept: undefined >> undefined
The following data gives the value (in crores of rupees) of the Indian export of cotton textiles for different years:
| Years | 1982 | 1983-1984 | 1984-1985 | 1985-1986 | 1986-1987 |
| Value of Export of Cotton Textiles (in crores of rupees) |
300 | 325 | 475 | 450 | 550 |
Represent the above data with the help of a bar graph. Indicate with the help of a bar graph the year in which the rate of increase in exports is maximum over the preceding year.
Concept: undefined >> undefined
The following tables gives the quantity of goods (in crore tonnes)
| Year | 1950-51 | 1960-61 | 1965-66 | 1970-71 | 1980-81 | 1982-83 |
| Quantity of Goods (in crore tonnes) |
9 | 16 | 20 | 20 | 22 | 26 |
Explain through the bar graph if the quantity of goods carried by the Indian Railways in 1965-66 is more than double the quantity of goods carried in the year 1950-51.
Concept: undefined >> undefined
The production of oil (in lakh tonnes) in some of the refineries in India during 1982 was given below:
| Refinery: | Barauni | Koyali | Mathura | Mumbai | Florida |
| Production of oil (in lakh tonnes) |
30 | 70 | 40 | 45 | 25 |
Construct a bar graph to represent the above data so that the bars are drawn horizontally.
Concept: undefined >> undefined
The expenditure (in 10 crores of rupees) on health by the Government of India during the various five year plans is shown below:
| Plans: | I | II | III | IV | V | VI |
| Expenditure on health (in 10 crores of rupees) |
7 | 14 | 23 | 34 | 76 | 182 |
Construct a bar graph to represent the above data.
Concept: undefined >> undefined
Construct a histogram for the following data:
| Monthly School fee (in Rs): |
30-60 | 60-90 | 90-120 | 120-150 | 150-180 | 180-210 | 210-240 |
| No of Schools | 5 | 12 | 14 | 18 | 10 | 9 | 4 |
Concept: undefined >> undefined
The distribution of heights (in cm) of 96 children is given below. Construct a histogram and a frequency polygon on the same axes.
| Height (in cm): | 124 to 128 |
128 to 132 |
132 to 136 |
136 to 140 |
140 to 144 |
144 to 148 |
148 to 152 |
152 to 156 |
156 to 160 |
160 to 164 |
| No. of Children: | 5 | 8 | 17 | 24 | 16 | 12 | 6 | 4 | 3 | 1 |
Concept: undefined >> undefined
The time taken, in seconds, to solve a problem by each of 25 pupils is as follows:
16, 20, 26, 27, 28, 30, 33, 37, 38, 40, 42, 43, 46, 46, 46, 48, 49, 50, 53, 58, 59, 60, 64, 52, 20
(a) Construct a frequency distribution for these data, using a class interval of 10 seconds.
(b) Draw a histogram to represent the frequency distribution.
Concept: undefined >> undefined
