Advertisements
Advertisements
प्रश्न
How can you find the following?
Velocity from acceleration – time graph.
Advertisements
उत्तर
Velocity from acceleration – time graph: Area under the acceleration – time graph gives the velocity of the body. When the body moves with variable velocity but uniform acceleration, then acceleration – time graph is a straight line (PQ) parallel to the time axis.
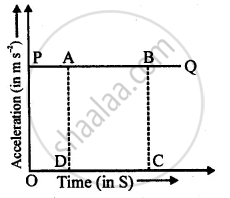
Take any two points A and B on PQ. From P and Q, draw perpendiculars (BC and AD) on the time axis. such that,
OD = t1 and OC = t2
Let OP = AD = BC = a = acceleration of the body.
Area under acceleration – time graph = area of rectangle ABCD
= AD × DC = AD × (OC − OD)
= a (t2 − t1)
= `("v"-"u")/(("t"_2-"t"_1))("t"_2-"t"_1)` = v − u
If initial velocity of the body = u = 0 Then area under acceleration – time graph = v – 0 = v = velocity of the body.
APPEARS IN
संबंधित प्रश्न
A train starting from a railway station and moving with uniform acceleration attains a speed 40 km h−1 in 10 minutes. Find its acceleration.
Explain why, the motion of a body which is moving with constant speed in a circular path is said to be accelerated.
A motorcycle moving with a speed of 5 m/s is subjected to an acceleration of 0.2 m/s2. Calculate the speed of the motorcycle after 10 seconds, and the distance travelled in this time.
For a uniformly retarded motion, the velocity-time graph is _____________
Multiple choice Question. Select the correct option.
The speed of a car reduces from 15 m/s to 5 m/s over a displacement of 10 m. The uniform acceleration of the car is :
Can you suggest a real-life example about the motion of a body from the following velocity – time graph?
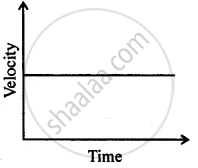
Can you suggest a real-life example about the motion of a body from the following velocity – time graph?
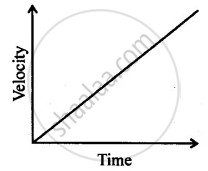
Can you suggest a real-life example about the motion of a body from the following velocity – time graph?
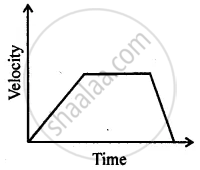
Can you suggest a real-life example about the motion of a body from the following velocity – time graph?
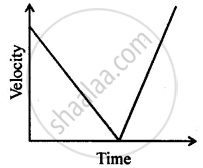
Draw a velocity versus time graph of a stone thrown vertically upwards and then coming downwards after attaining the maximum height.
