Advertisements
Advertisements
प्रश्न
Draw displacement – time graph for the following situation:
When a body is stationary.
Advertisements
उत्तर
Displacement – time graph when a body is stationary.

APPEARS IN
संबंधित प्रश्न
What does the slope of a speed-time graph indicate ?
What can you say about the motion of a body if:
its velocity-time graph is a straight line ?
Diagram shows a velocity – time graph for a car starting from rest. The graph has three sections AB, BC and CD.

From a study of this graph, state how the distance travelled in any section is determined.
How will you use a speed-time graph to find whether the acceleration of the body is uniform or not?
Interpret the following graph: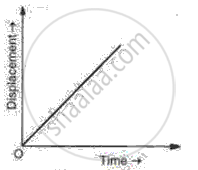
Draw distance-time graph to show:
Decreasing velocity
Draw velocity-time graph to show:
Zero acceleration
Write a sentence to explain the shape of graph.
The given graph shows the variation of velocity (v) with position (x) for a particle moving along a straight line
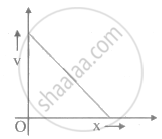
Which of the following graph shows the variation of acceleration (a) with position (x)?
If the velocity-time graph has the shape AMB, what would be the shape of the corresponding acceleration-time graph?

The velocity-displacement graph describing the motion of a bicycle is shown in the figure.

The acceleration-displacement graph of the bicycle's motion is best described by:
