Please select a subject first
Advertisements
Advertisements
Subtract: −2(xy)2 (y3 + 7x2y + 5) from 5y2 (x2y3 – 2x4y + 10x2)
Concept: undefined >> undefined
One number is seven times another. If their difference is 18, find the numbers
Concept: undefined >> undefined
Advertisements
In the given figure, ΔBCD is isosceles with base BD and ∠BAE ≡∠DEA. Prove that AB ≡ ED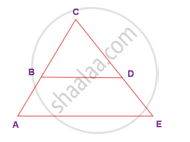
Concept: undefined >> undefined
In the figure, given that ∠1 = ∠2 and ∠3 ≡ ∠4. Prove that ∆MUG ≡ ∆TUB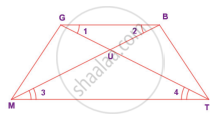
Concept: undefined >> undefined
Identify the following data can be represented in a histogram?
The number of mountain climbers in the age group 20 to 60 in Tamil Nadu.
Concept: undefined >> undefined
Identify the following data can be represented in a histogram?
Production of cycles in different years
Concept: undefined >> undefined
Identify the following data can be represented in a histogram?
The number of students in each class of a school
Concept: undefined >> undefined
Identify the following data can be represented in a histogram?
The number of votes polled from 7 am to 6 pm in an election
Concept: undefined >> undefined
Identify the following data can be represented in a histogram?
The wickets fallen from 1 over to 50th over in a one day cricket match
Concept: undefined >> undefined
The total area of the histogram is _________ to the total frequency of the given data
Concept: undefined >> undefined
A graph that displays data that changes continuously over the periods of time is _________
Concept: undefined >> undefined
Histogram is a graphical representation of ___________ data
Concept: undefined >> undefined
In a village, there are 570 people who have cell phones. An NGO survey their cell phone usage. Based on this survey a histogram is drawn
How many people use the cell phone for less than 3 hours?
Concept: undefined >> undefined
In a village, there are 570 people who have cell phones. An NGO survey their cell phone usage. Based on this survey a histogram is drawn
How many of them use the cell phone for more than 5 hours?
Concept: undefined >> undefined
In a village, there are 570 people who have cell phones. An NGO survey their cell phone usage. Based on this survey a histogram is drawn
Are people using cell phone for less than 1 hour?
Concept: undefined >> undefined
Draw a histogram for the following data.
| Class Interval | 0 − 10 | 10 − 20 | 20 − 30 | 30 − 40 | 40 − 50 | 50 − 60 |
| No. of students | 5 | 15 | 23 | 20 | 10 | 7 |
Concept: undefined >> undefined
Construct a histogram from the following distribution of total marks of 40 students in a class.
| Marks | 90 − 110 | 110 − 130 | 130 − 150 | 150 − 170 | 170 − 190 | 190 − 210 |
| No. of Students | 9 | 5 | 10 | 7 | 4 | 6 |
Concept: undefined >> undefined
The marks obtained by 50 students in Mathematics are given below.
(i) Make a frequency distribution table taking a class size of 10 marks
(ii) Draw a histogram and a frequency polygon.
| 52 | 33 | 56 | 52 | 44 | 59 | 47 | 61 | 49 | 61 |
| 47 | 52 | 67 | 39 | 89 | 57 | 64 | 58 | 63 | 65 |
| 32 | 64 | 50 | 54 | 42 | 48 | 22 | 37 | 59 | 63 |
| 36 | 35 | 48 | 48 | 55 | 62 | 74 | 43 | 41 | 51 |
| 08 | 71 | 30 | 18 | 43 | 28 | 20 | 40 | 58 | 49 |
Concept: undefined >> undefined
The graphical representation of ungrouped data is ________
Concept: undefined >> undefined
Histogram is a graph of a ________ frequency distribution
Concept: undefined >> undefined
