Advertisements
Advertisements
Question
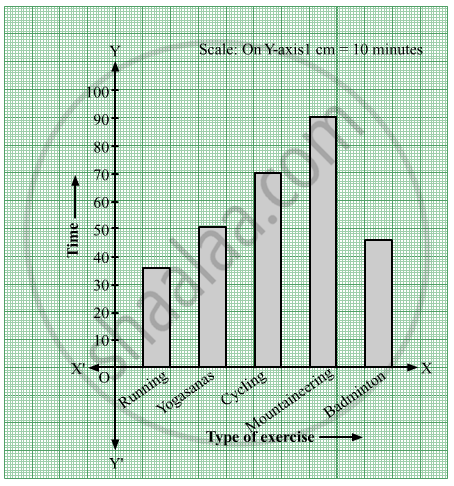
Yashwant gives different amounts of time as shown below, to different exercises he does during the week. Draw a bar graph to show the details of his schedule using an appropriate scale.
| Type of exercise | Running | Yogasanas | Cycling | Mountaineering | Badminton |
| Time | 35 Minutes | 50 minutes | 1 hr 10 min | `1 1/2` hours | 45 minutes |
Advertisements
Solution
Steps to draw the bar graph:
- In the centre of the graph paper, write the title "Exercises and time".
- Draw the X-axis and Y-axis, and mark O, their point of intersection.
- Write the type of exercise on the X-axis at equal distances.
- The time is taken on the Y-axis.
- Write the scale in the top right-hand corner i.e. 1 cm = 10 minutes on the Y-axis.
Here, `1 1/2` hours = 1 hour 30 minutes = 90 minutes, 1 hr 10 min = 70 minutes (1 hour = 60 minutes) - Draw a bar of the appropriate height above the type of each exercise on the X-axis.
RELATED QUESTIONS
This bar graph shows the maximum temperatures in degrees Celsius in different cities on a certain day in February. Observe the graph and answer the questions.

- What data is shown on the vertical and the horizontal lines?
- Which city had the highest temperature?
- Which cities had equal maximum temperatures?
- Which cities had a maximum temperature of 30° C?
- What is the difference between the maximum temperatures of Panchgani and Chandrapur?
The names of the heads of some families in a village and the quantity of drinking water their family consumes in one day are given below. Draw a bar graph for this data.
(Scale: On Y-axis, 1cm = 10 litres of water)
| Name | Ramesh | Shobha | Ayub | Julie | Rahul |
| Litres of water used | 30 litres | 60 litres | 40 litres | 50 litres | 55 litres |
The following data gives total marks (out of 600) obtained by six children of a particular class. Represent the data on a bar graph.
| Students | Ajay | Bali | Dipti | Faiyaz | Geetika | Hari |
| Marks Obtained | 450 | 500 | 300 | 360 | 400 | 540 |
A bar graph can be drawn using ______________
The table shows the number of moons that orbit each of the planets in our solar system.
| Planet | Mercury | Venus | Earth | Mars | Jupiter | Saturn | Uranus | Neptune |
| Number of Moons |
0 | 0 | 1 | 2 | 28 | 30 | 21 | 8 |
Make a Bar graph for the above data
The cost of a note book is Rs 10. Draw a graph after making a table showing cost of 2, 3, 4, .... note books. Use it to find
- the cost of 7 notebooks.
- the number of note books that can be purchased with Rs 50.
Draw a graph for the radius and circumference of circle using a suitable scale.
(Hint: Take radius = 7, 14, 21 units and so on)
From the graph,
- Find the circumference of the circle when radius is 42 units.
- At what radius will the circumference of the circle be 220 units?
The number of ATMs of different banks in a city is shown below:
| Bank | Number of ATMs |
| Syndicate Bank | 5 |
| Dena Bank | 15 |
| Indian Bank | 20 |
| State Bank of India | 25 |
| Vijaya Bank | 10 |
Draw a bar graph to represent the above information by choosing the scale of your choice.
The number of people in various age groups in a town is given in the following table.
| Age group | 1-14 | 15-29 | 30-44 | 45-59 | 60-74 | 75 and above |
| Number of persons | 2 lakhs |
1 lakh |
1 lakh |
1 lakh |
80 thousand | 40 thousand |
Draw a bar graph to represent the above information and answer the following questions. (take 1 unit length = 20 thousands)
- Which two age groups have the same population?
- All persons in the age group of 60 and above are called senior citizens. How many senior citizens are there in the town?
A nursery has 70 Mogara plants, and the scale chosen is 1 cm = 10 plants. What should be the height of the bar representing Mogara?
