Advertisements
Advertisements
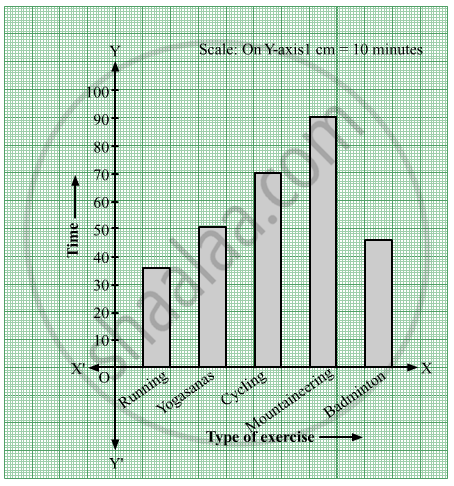
प्रश्न
Yashwant gives different amounts of time as shown below, to different exercises he does during the week. Draw a bar graph to show the details of his schedule using an appropriate scale.
| Type of exercise | Running | Yogasanas | Cycling | Mountaineering | Badminton |
| Time | 35 Minutes | 50 minutes | 1 hr 10 min | `1 1/2` hours | 45 minutes |
Advertisements
उत्तर
Steps to draw the bar graph:
- In the centre of the graph paper, write the title "Exercises and time".
- Draw the X-axis and Y-axis, and mark O, their point of intersection.
- Write the type of exercise on the X-axis at equal distances.
- The time is taken on the Y-axis.
- Write the scale in the top right-hand corner i.e. 1 cm = 10 minutes on the Y-axis.
Here, `1 1/2` hours = 1 hour 30 minutes = 90 minutes, 1 hr 10 min = 70 minutes (1 hour = 60 minutes) - Draw a bar of the appropriate height above the type of each exercise on the X-axis.
संबंधित प्रश्न
The names of the heads of some families in a village and the quantity of drinking water their family consumes in one day are given below. Draw a bar graph for this data.
(Scale: On Y-axis, 1cm = 10 litres of water)
| Name | Ramesh | Shobha | Ayub | Julie | Rahul |
| Litres of water used | 30 litres | 60 litres | 40 litres | 50 litres | 55 litres |
Chitra has to buy Laddus in order to distribute to her friends as follow: Draw a Bar Graph for this data
| Classes | VI | VII | VIII | IX | X |
| Number of Laddus | 70 | 60 | 45 | 80 | 55 |
The fruits liked by the students of a class are as follow: Draw a Bar Graph for this data.
| Fruits | Bananas | Grapes | Apples | Mangoes | Guavas | Papayas | Other fruits |
| Number of students |
8 | 10 | 8 | 7 | 12 | 3 | 2 |
The table shows the number of moons that orbit each of the planets in our solar system.
| Planet | Mercury | Venus | Earth | Mars | Jupiter | Saturn | Uranus | Neptune |
| Number of Moons |
0 | 0 | 1 | 2 | 28 | 30 | 21 | 8 |
Make a Bar graph for the above data
The cost of a note book is Rs 10. Draw a graph after making a table showing cost of 2, 3, 4, .... note books. Use it to find
- the cost of 7 notebooks.
- the number of note books that can be purchased with Rs 50.
The cost of a notebook is Rs 10. Draw a graph after making a table showing cost of 2, 3, 4, .... notebooks. Use it to find the number of note books that can be purchased with Rs 50
The following table gives the data of number of schools (stage-wise) of a country in the year 2002.
| Stage | Number of schools (in thousands) |
| Primary | 80 |
| Upper Primary | 55 |
| Secondary | 30 |
| Higher Secondary | 20 |
Draw a bar graph to represent the above data:
In a botanical garden, the number of different types of plants are found as follows:
| Type of the plants | Number of plants |
| Herb | 50 |
| Shrub | 60 |
| Creeper | 20 |
| Climber | 45 |
| Tree | 95 |
Draw a bar graph to represent the above information and answer the following questions:
- Which type of plant is maximum in number in the garden?
- Which type of plant is minimum in number in the garden?
What is the primary characteristic that distinguishes bar graphs from other forms of data representation?
Which element is classified as representing the "numerical values (frequency, amount, or measure)" in a bar graph?
