Advertisements
Advertisements
Question
With the help of given statistical data about the per capita incomes of India and Brazil. Prepare a simple bar graph and answer the following questions.
| Years/Countries Name | 1960 | 1980 | 2000 | 2016 |
| Brazil | 240 | 2010 | 3060 | 8840 |
| India | 90 | 280 | 450 | 1680 |
- When was the per capita income lowest for Brazil?
- When did the per capita income of India increase drastically?
- What can be generally inferred from the data by comparing the per capita income of the two countries?
Advertisements
Solution
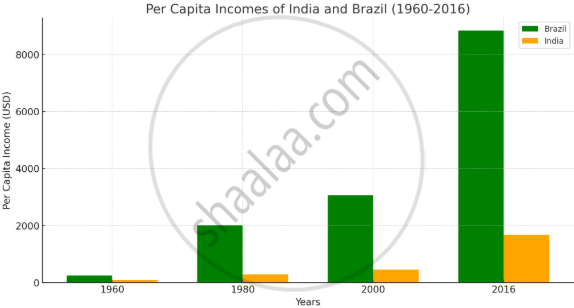
- The per capita income of Brazil was lowest during the year 1960.
- The per capita income of India saw the maximum improvement in the years between 2000-2016.
- When we compare the per capita income of the two countries we find that India is far behind Brazil.
APPEARS IN
RELATED QUESTIONS
Why has mining not developed in the western part of Brazil?
What are the similarities in the fishing activities in Brazil and India?
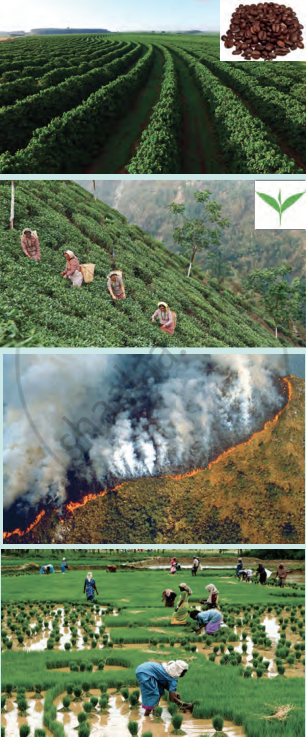
The following images are related to agricultural activities. Identify and write whether they are practised in Brazil or India.
Identify the odd factor.
Major crops of Brazil:
Write answer in one sentence-
Which major crop is exported from Brazil?
Observe the following graph and answer the questions given below:

- In which decade did the Indian trade contribution to GDP overtake that of Brazil?
- According to the graph, what is the highest percentage contribution to the GDP of Indian trade?
- What was the condition of Indian trade in the decade of 1960-70?
- In which decade did trade in Brazil suffer badly?
- How has Indian trade performed in the years 2010-16?
- What has been the contribution of Brazilian trade to the GDP in the years 2010-16?
Look at the map given below. The major primary occupations in Brazil are shown here. Discuss the following points and write your observations.
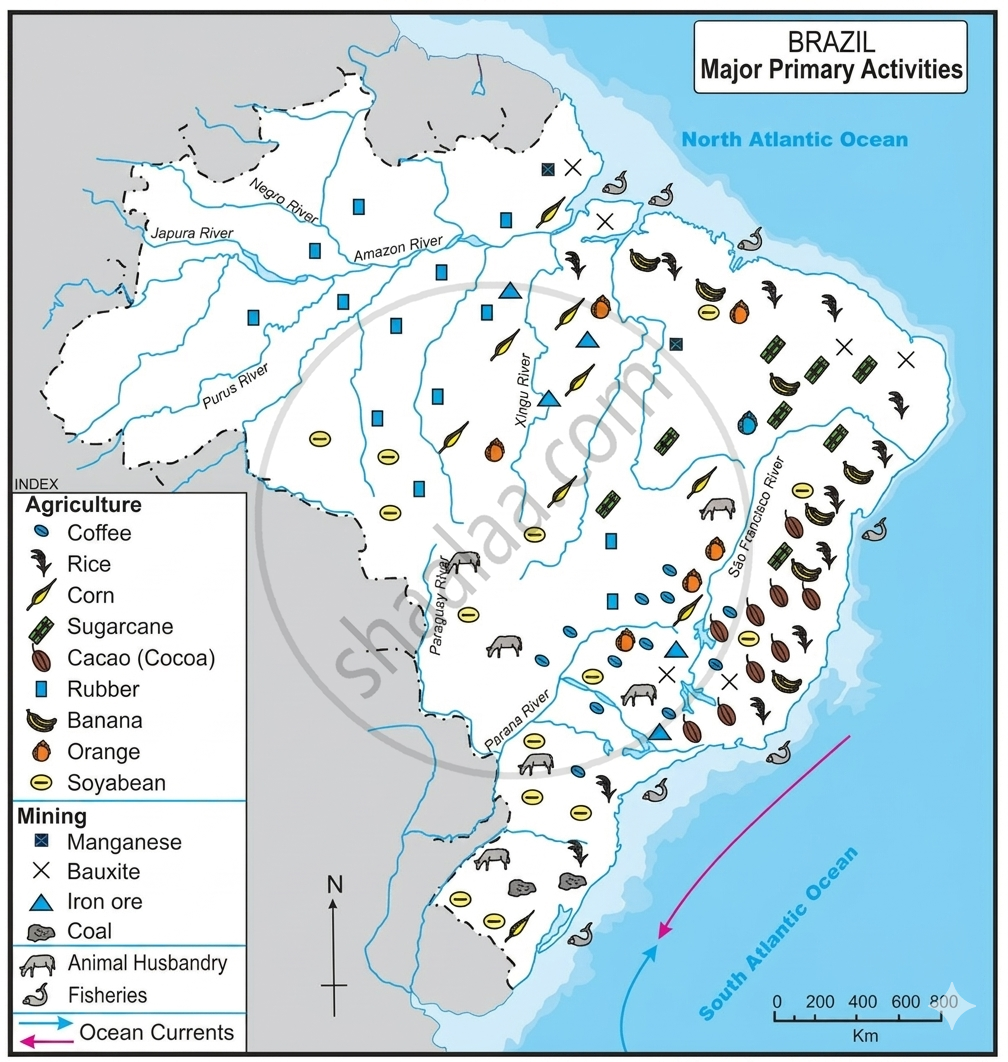
- In which part of Brazil is coffee mainly produced?
- Which food crops are mainly grown in Brazil?
- Can you relate the production of these crops with the climate there?
- Where are the rubber plantations concentrated?
- Complete the table.
Type of crops Crops Areas of production Food crops Cash Crops Fruits and Vegetables
Observe the figure and answer the following questions.
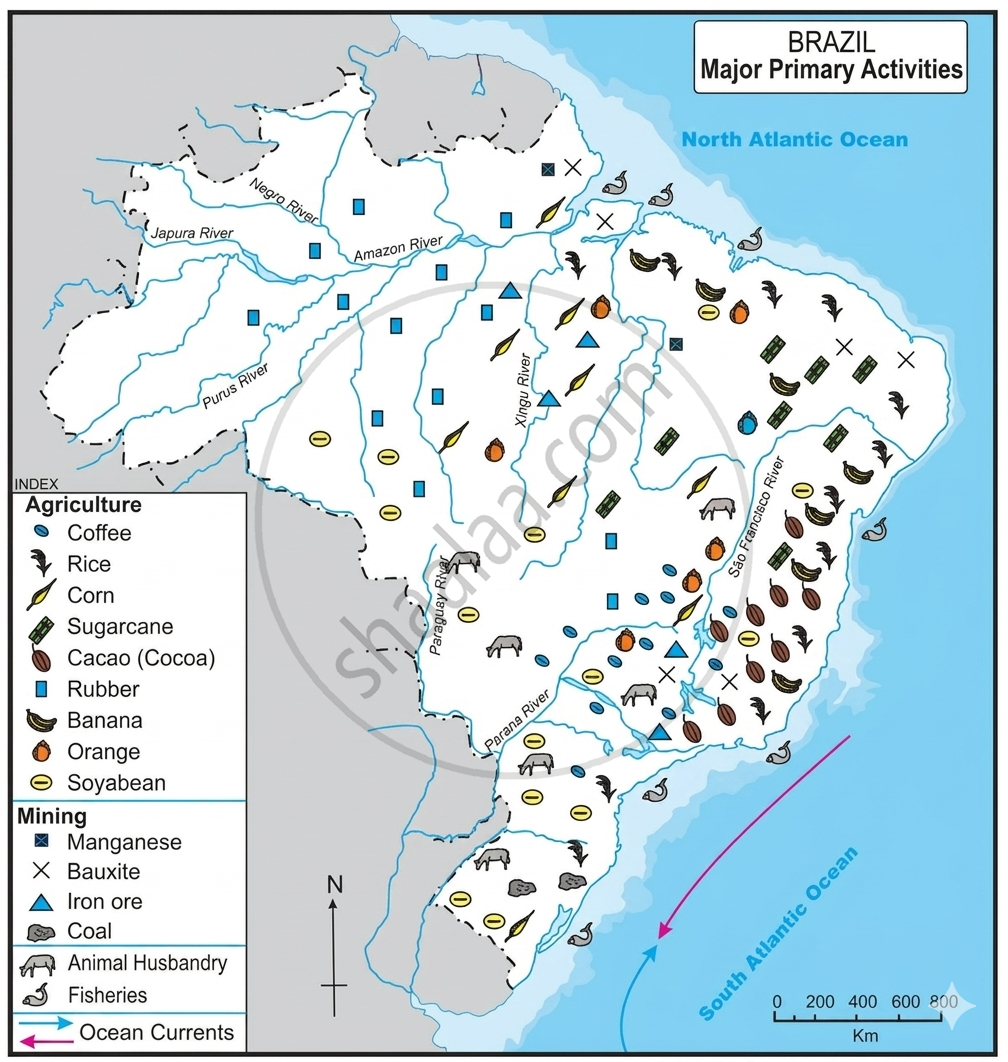
- Prepare a table of mining products and regions of production in Brazil.
- In which part of Brazil has mining activity not developed? What could be the reasons?
- Considering the availability of resources, were has the development of industries occurred?
- Can you give two reasons of concentration of fishing near the south-eastern coast of Brazil?
- Inland fishing is not developed in Brazil though there is large number of rivers in Brazil. Can you think of a reason?
Answer the questions on the basis of given figure
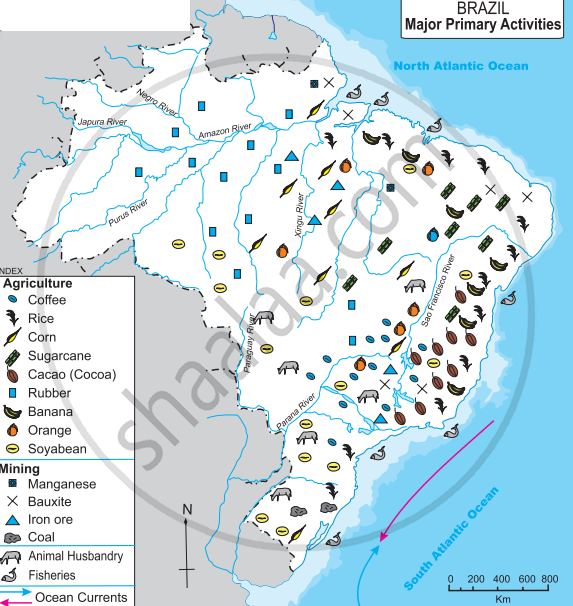 |
- Can you give two reasons of concentration of fishing near the south-eastern coast of Brazil?
- Inland fishing is not developed in Brazil though there is large number of rivers in Brazil. Can you think of a reason?
Name the warm and cold ocean currents near Brazilian coasts.
