Advertisements
Advertisements
Question
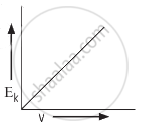
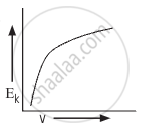
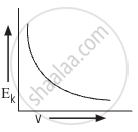
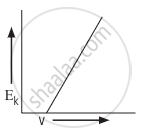
Which of the following graphs correctly represents the variation of maximum kinetic energy (Ek) of photoelectrons with the frequency (𝜈) of the incident radiation?
Options
MCQ
Advertisements
Solution
shaalaa.com
Is there an error in this question or solution?
