Advertisements
Advertisements
प्रश्न
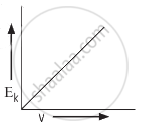
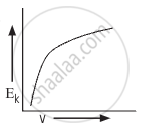
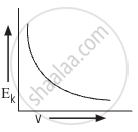
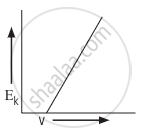
Which of the following graphs correctly represents the variation of maximum kinetic energy (Ek) of photoelectrons with the frequency (𝜈) of the incident radiation?
विकल्प
MCQ
Advertisements
उत्तर
shaalaa.com
क्या इस प्रश्न या उत्तर में कोई त्रुटि है?
