English

Which of the following diagram correctly depicts the situation of Less Elastic Demand?

Advertisements
Advertisements

Question

Which of the following diagram correctly depicts the situation of Less Elastic Demand?

Options
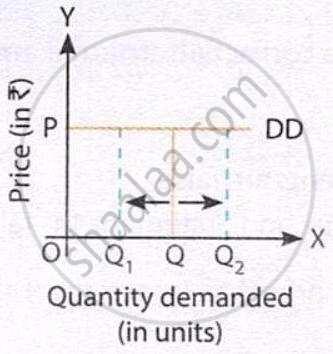
  • The diagram shows a horizontal demand curve DD, indicating perfectly elastic demand (Ed = ∞), where quantity demanded changes from OQ₁ to OQ₂ at the same price OP.

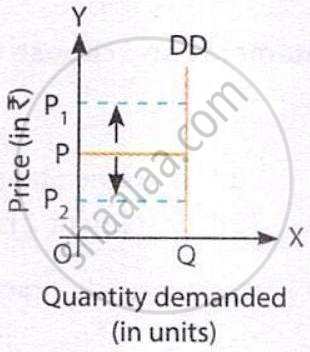
  • The diagram shows a vertical demand curve DD, indicating perfectly inelastic demand (Ed = 0), where quantity demanded remains constant at OQ despite changes in price from OP₁ to OP₂.

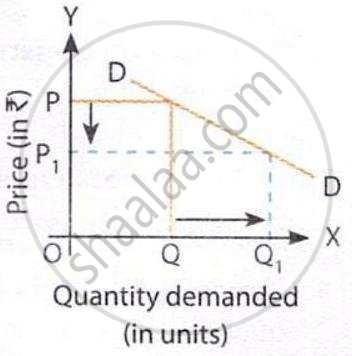
  • The diagram shows a downward-sloping demand curve DD, indicating highly elastic demand (Ed > 1), where a fall in price from OP to OP₁ causes a proportionately greater increase in quantity demanded from OQ to OQ₁.

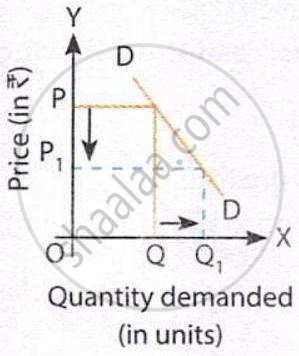
  • The diagram shows a downward-sloping demand curve DD, indicating highly elastic demand (Ed > 1), where a fall in price from OP to OP₁ causes a proportionately greater increase in quantity demanded from OQ to OQ₁.

MCQ
Advertisements

Solution

The diagram shows a downward-sloping demand curve DD, indicating highly elastic demand (Ed > 1), where a fall in price from OP to OP₁ causes a proportionately greater increase in quantity demanded from OQ to OQ₁.

Explanation:

The answer key identifies diagram (c). The horizontal and vertical diagrams represent perfectly elastic and perfectly inelastic demand, respectively; the provided descriptions for (c) and (d) appear identical, but the source key marks (c).

shaalaa.com
  Is there an error in this question or solution?
Chapter 4: Elasticity of Demand - OBJECTIVE QUESTIONS [Page 4.39]

APPEARS IN

Sandeep Garg Introductory Microeconomics [English] Class 11
Chapter 4 Elasticity of Demand
OBJECTIVE QUESTIONS | Q 23. | Page 4.39
Share
Notifications

Englishहिंदीमराठी


      Forgot password?
Use app×