Advertisements
Advertisements
Question
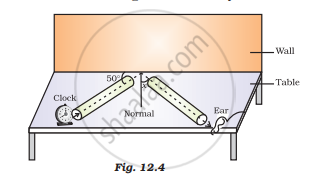
Which of the above two graphs (a) and (b) (Fig.12.3) representing the human voice is likely to be the male voice? Give a reason for your answer.
Advertisements
Solution
Usually, the male voice has less pitch (or frequency) as compared to the female voice.
As the time period of wave represented by a graph (a) is more than that of the graph (b), so, graph (a) represents a lower frequency wave than graph (b) and hence is likely to be the male voice.
APPEARS IN
RELATED QUESTIONS
What is the audible range of the average human ear?
What is the difference between infrasonic waves and ultrasonic waves ?
Which of the following sound frequencies cannot be heard by a human ear ?
(i) 10 Hz
(ii) 100 Hz
(iii) 10,000 Hz
(iv) 15 Hz
(v) 40,000 Hz
What are infrasonic waves ? Name two animals which produce infrasonic waves.
What are ultrasonic waves ? Name two animals which can produce ultrasonic waves.
The audible range of frequencies of an average human ear is from 20 Hz to 20 kHz. Calculate the corresponding wavelengths. (Speed of sound in air is 344 ms–1)
Three different vibrating objects produce three-types of sounds X, Y and Z. Sounds X and Y cannot be heard by a man having normal range of hearing but sound Z can be heard easily. The sound X is used in hospitals to break kidney stones of a patient into fine grains which then get flushed out with urine. The sound Y is similar to that which is produced during an earthquake before the main shock wave is generated.
(a) What type of sounds are (i) X (ii) Y, and (iii) Z ?
(b) Name one device which can produce sound like X.
(c) Name one device in a science laboratory which can produce sound like Y.
(d) Name one device in our homes which can produce sound like Z.
(e) What is the frequency range of sounds like Z ?
One of the following can hear infrasound. This one is :
A girl is sitting in the middle of a park of dimension 12 m × 12 m. On the left side of it, there is a building adjoining the park and on the right side of the park, there is a road adjoining the park. A sound is produced on the road by a cracker. Is it possible for the girl to hear the echo of this sound? Explain your answer.
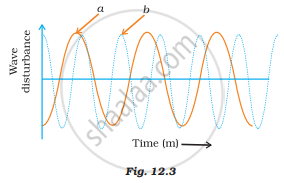
For hearing the loudest ticking sound heard by the ear, find the angle x in Fig.12.4.