Advertisements
Advertisements
Question
Answer the question based on the information given in the following table. A, B, C, D, E denote companies and 2006, 2007, 2008. 2009& 2010 denote years.
| A | B | C | D | E | ||||||
| M | S | M | S | M | S | M | S | M | S | |
| 2006 | 2.8 | 1.3 | 3.3 | 2.2 | 2.6 | 1.7 | 3.0 | 2.2 | 1.9 | 1.4 |
| 2007 | 3.2 | 2.0 | 2.4 | 1.6 | 2.2 | 1.5 | 2.5 | 1.9 | 2.0 | 1.7 |
| 2008 | 1.9 | 0.9 | 2.9 | 1.6 | 2.1 | 1.0 | 2.3 | 1.5 | 1.6 | 1.1 |
| 2009 | 1.0 | 0.4 | 2.4 | 1.3 | 2.8 | 1.4 | 2.1 | 1.2 | 3.2 | 2.5 |
| 2010 | 2.5 | 1.5 | 2.3 | 1.2 | 2.6 | 2.1 | 1.8 | 1.1 | 3.1 | 2.6 |
What is the respective ratio of total number of units manufactured by Company A and B together in the year 2009 to those sold by them 1n the same year?
Options
2.01
3.02
5.02
None of the above
Advertisements
Solution
2.01
Explanation:
Total number of units manufactured by company A and B together in 2009 = 1.0 + 2.4 = 3.4
Total number of units sold by company A and B together in the year 2009
= 0.4 + 1.3 = 1.7
∴ Required ratio =`3.4/1.7=2:1`
APPEARS IN
RELATED QUESTIONS
Direction : Answer the question on the basis of the information given below.
The pie chart given below shows the percentage of print space allocation of articles printed on different sections of a newspaper.
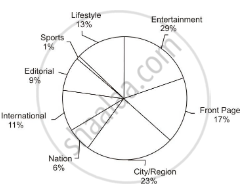
If the total number of words printed in the 'International' section was approximately 88770, then which of the following is the closest approximation of the total number of words printed in the 'Lifestyle' section?
Direction : Answer the question on the basis of the information given below.
The table given below shows information about the toys manufactured by 6 different companies. Each company manufactures only two types of toys – vehicles and dolls. Among toy vehicles each company manufactures Cars and Trucks only. The table shows the number of toy vehicles as a percentage of total toys manufactured by each company. It also shows the ratio of Cars and Trucks manufactured. Each company manufactured a total of 50000 toys in a year.
| Company | Toy vehicles | Cars : Trucks |
| R | 50 % | 1:4 |
| S | 70% | 3:1 |
| T | 40% | 1:1 |
| U | 30% | 1:2 |
| V | 60% | 2:3 |
| W | 40% | 2:1 |
What is the total number of toy cars manufactured by company T and S together?
Direction: Answer the question on the basis of the information given below.
The table given below shows information about the toys manufactured by 6 different companies. Each company manufactures only two types of toys – vehicles and dolls. Among toy vehicles each company manufactures Cars and Trucks only. The table shows the number of toy vehicles as a percentage of total toys manufactured by each company. It also shows the ratio of Cars and Trucks manufactured. Each company manufactured a total of 50000 toys in a year.
| Company | Toy vehicles | Cars : Trucks |
| R | 50 % | 1:4 |
| S | 70% | 3:1 |
| T | 40% | 1:1 |
| U | 30% | 1:2 |
| V | 60% | 2:3 |
| W | 40% | 2:1 |
What percentage of the total number of toys produced by company S is the total number of cars produced by the same company?
The pie chart below shows the Indian Government’s interim budget allocation for the year 2019-2020 in percentage terms. All the questions below should be answered solely based on the pie chart below.

If the Government’s budgetary allocation for ‘Pension’ is Rs. 1.7 lakh crore, which of the following is the closest approximation of the total budget amount of the Government?
The pie chart below shows the Indian Government’s interim budget allocation for the year 2019-2020 in percentage terms. All the questions below should be answered solely based on the pie chart below.
What percentage of the total budget has been earmarked for ‘Agriculture and Allied Activities’, ‘Subsidy-Fertilizer’ and ‘Subsidy-Food’, collectively?
The pie chart below shows the Indian Government’s interim budget allocation for the year 2019-2020 in percentage terms. All the questions below should be answered solely based on the pie chart below.
What percentage (approximately) of the budgetary allocation for ‘Transfer to States’ is the budgetary allocation for ‘Pension’?
Two equations that can be drawn as same line on graph then these equations are considered as
Point of intersection of axes in three dimension coordinate system is called
Constructed on XY - plane, a histogram is a graph of adjacent
Minimum and maximum values defined for a class or group is called
