Advertisements
Advertisements
Question
Answer the question based on the information given in the following table. A, B, C, D, E denote companies and 2006, 2007, 2008. 2009& 2010 denote years.
| A | B | C | D | E | ||||||
| M | S | M | S | M | S | M | S | M | S | |
| 2006 | 2.8 | 1.3 | 3.3 | 2.2 | 2.6 | 1.7 | 3.0 | 2.2 | 1.9 | 1.4 |
| 2007 | 3.2 | 2.0 | 2.4 | 1.6 | 2.2 | 1.5 | 2.5 | 1.9 | 2.0 | 1.7 |
| 2008 | 1.9 | 0.9 | 2.9 | 1.6 | 2.1 | 1.0 | 2.3 | 1.5 | 1.6 | 1.1 |
| 2009 | 1.0 | 0.4 | 2.4 | 1.3 | 2.8 | 1.4 | 2.1 | 1.2 | 3.2 | 2.5 |
| 2010 | 2.5 | 1.5 | 2.3 | 1.2 | 2.6 | 2.1 | 1.8 | 1.1 | 3.1 | 2.6 |
What is the average number of units sold by company D over all the years together?
Options
166
158
136
147
Advertisements
Solution
158
Explanation:
From the table,
Total number of units sold by company D over all the years together
= 2.2 + 1.9 + 1.5 + 12 + 1.1
= 7.9 hundred = 790
∴ Average number of units sold by company D over all the years together`=790/5=158`
APPEARS IN
RELATED QUESTIONS
Direction: Answer the question on the basis of the information given below.
The pie chart given below shows the percentage of print space allocation of articles printed on different sections of a newspaper.
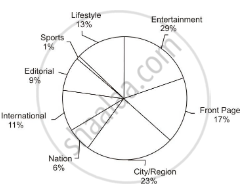
What percentage of the total space allocation has been earmarked for 'City/ Region', 'Nation' and 'International' news cumulatively?
Direction: Answer the question on the basis of the information given below.
The pie chart given below shows the percentage of print space allocation of articles printed on different sections of a newspaper.
If the entire space allocated to 'Entertainment' is split equally between 'Sports' and 'Nation' and the total number of words in the Nation section is now 256000, then what would be the total number of words in the 'Sports' section?
Direction: Answer the question on the basis of the information given below.
The pie chart given below shows the percentage of print space allocation of articles printed on different sections of a newspaper.
What percentage (approximately) more than the print space allocation for 'Editorial' in the print space allocation for 'Front Page'?
Direction: Answer the question on the basis of the information given below.
The table given below shows information about the toys manufactured by 6 different companies. Each company manufactures only two types of toys – vehicles and dolls. Among toy vehicles each company manufactures Cars and Trucks only. The table shows the number of toy vehicles as a percentage of total toys manufactured by each company. It also shows the ratio of Cars and Trucks manufactured. Each company manufactured a total of 50000 toys in a year.
| Company | Toy vehicles | Cars : Trucks |
| R | 50 % | 1:4 |
| S | 70% | 3:1 |
| T | 40% | 1:1 |
| U | 30% | 1:2 |
| V | 60% | 2:3 |
| W | 40% | 2:1 |
What percentage of the total number of toys produced by company S is the total number of cars produced by the same company?
Answer the question based on the information given in the following table. A, B, C, D, E denote companies and 2006, 2007, 2008. 2009& 2010 denote years.
| A | B | C | D | E | ||||||
| M | S | M | S | M | S | M | S | M | S | |
| 2006 | 2.8 | 1.3 | 3.3 | 2.2 | 2.6 | 1.7 | 3.0 | 2.2 | 1.9 | 1.4 |
| 2007 | 3.2 | 2.0 | 2.4 | 1.6 | 2.2 | 1.5 | 2.5 | 1.9 | 2.0 | 1.7 |
| 2008 | 1.9 | 0.9 | 2.9 | 1.6 | 2.1 | 1.0 | 2.3 | 1.5 | 1.6 | 1.1 |
| 2009 | 1.0 | 0.4 | 2.4 | 1.3 | 2.8 | 1.4 | 2.1 | 1.2 | 3.2 | 2.5 |
| 2010 | 2.5 | 1.5 | 2.3 | 1.2 | 2.6 | 2.1 | 1.8 | 1.1 | 3.1 | 2.6 |
What is the approximate percent increase in the number of units sold by Company E in the year 2007 from the previous year?
The pie chart below shows the Indian Government’s interim budget allocation for the year 2019-2020 in percentage terms. All the questions below should be answered solely based on the pie chart below.

What percentage (approximately) of the budgetary allocation for ‘Transfer to States’ is the budgetary allocation for ‘Pension’?
Types of frequency distribution are
Data presented in form of frequency data is known as
A cumulative frequency table is also known as
Two straight lines in same plane which never meet are called
