Advertisements
Advertisements
Question
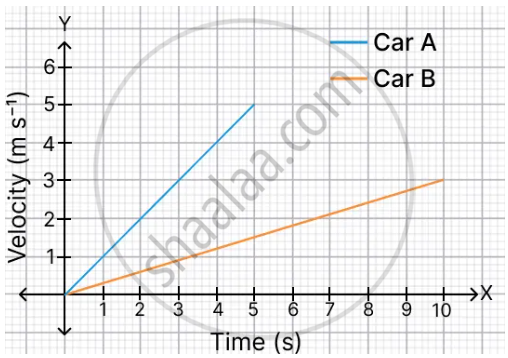
Two cars A and B start moving with a constant acceleration from rest in a straight line. Car A attains a velocity of 5 m s–1 in 5 s. Car B attains a velocity of 3 m s–1 in 10 s. Plot the velocity-time graphs for both the cars in the same graph. Using the graph, calculate the displacement mentioned in the two time intervals (Hint: Calculate the acceleration in both cases. Then calculate their velocities at five instants of time to plot the graph).
Advertisements
Solution
Acceleration of Car A:
u = 0, v = 5 m s–1, t = 5 s
aA = `(v - u)/t`
`(5 - 0)/5`
= m s–2
Acceleration of Car B:
u = 0, v = 3 m s–1, t = 10 s
aB = `(v - u)/t`
= `(3 - 0)/10`
= 0.3 m s–2
Velocities at various points in time (using v = u + at):
| Car A | Car B |
| At 0 s: 0 m s–1 | At 0 s: 0 m s–1 |
| At 1 s: 1 m s–1 | At 2 s: 0.6 m s–1 |
| At 2 s: 2 m s–1 | At 4 s: 1.2 m s–1 |
| At 3 s: 3 m s–1 | At 6 s: 1.8 m s–1 |
| At 4 s: 4 m s–1 | At 8 s: 2.4 m s–1 |
| At 5 s: 5 m s–1 | At 10 s: 3 m s–1 |
Plotting these points results in two straight lines that begin at the origin; the line for A is steeper than the line for B.
Displacement = area under the velocity-time graph
Displacement of Car A (in 5 s) = area of triangle = `1/2 xx "base" xx "height"`
= `1/2 xx 5 xx 5`
= 12.5 m
Displacement of Car B (in 10 s) = area of triangle = `1/2 xx "base" xx "height"`
= `1/2 xx 10 xx 3`
= 15 m
Hence, Car A travels 12.5 m in 5 s, and Car B travels 15 m in 10 s.
