Advertisements
Advertisements
Question
The inequality representing the following graph is ______.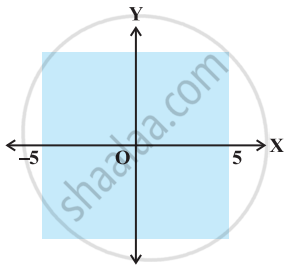
Options
|x| < 5
|x| ≤ 5
|x| > 5
|x| ≥ 5
MCQ
Fill in the Blanks
Advertisements
Solution
The inequality representing the following graph is |x| < 5.
Explanation:
The given graph represents x > –5 and x < 5.
Combining the two inequalities |x| < 5.
shaalaa.com
Is there an error in this question or solution?
