Advertisements
Advertisements
प्रश्न
The inequality representing the following graph is ______.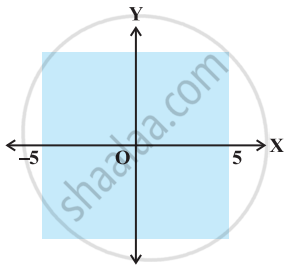
विकल्प
|x| < 5
|x| ≤ 5
|x| > 5
|x| ≥ 5
MCQ
रिक्त स्थान भरें
Advertisements
उत्तर
The inequality representing the following graph is |x| < 5.
Explanation:
The given graph represents x > –5 and x < 5.
Combining the two inequalities |x| < 5.
shaalaa.com
क्या इस प्रश्न या उत्तर में कोई त्रुटि है?
