Advertisements
Advertisements
Question
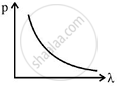
The graph showing the correct variation of linear momentum (p) of a charge particle with its de-Broglie wavelength (λ) is -
Options
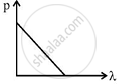
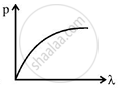
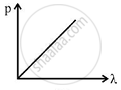
MCQ
Advertisements
Solution
Explanation:
According to de-Broglie relation,
λ = `h/p`
⇒ p = `h/lambda`
Thus, momentum p is inversely proportional to wavelength λ, so the graph is a decreasing curve of a rectangular hyperbola.
shaalaa.com
Is there an error in this question or solution?
