Advertisements
Advertisements
Question
The following table shows the percentages of demands for different fruits registered with a fruit vendor. Show the information by a pie diagram.
| Fruits | Mango | Sweet lime | Apples | Cheeku | Oranges |
| Percentages of demand | 30 | 15 | 25 | 20 | 10 |
Chart
Advertisements
Solution
The measures of central angles are given in the table.
| Fruits | Percentages of demand | Central Angle |
| Mango | 30 |
\[\frac{30}{100} \times 360 = 108^\circ\]
|
| Sweet lime | 15 |
\[\frac{15}{100} \times 360 = 54^\circ\]
|
| Apples | 25 |
\[\frac{25}{100} \times 360 = 90^\circ\]
|
| Cheeku | 20 |
\[\frac{20}{100} \times 360 = 72^\circ\]
|
| Oranges | 10 |
\[\frac{10}{100} \times 360 = 36^\circ\]
|
| Total | 100 |
The pie diagram showing the above data is given below: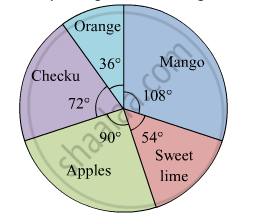
shaalaa.com
Is there an error in this question or solution?
