Advertisements
Advertisements
Question
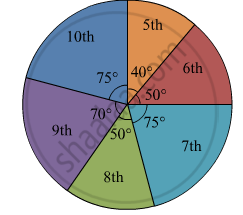
In a tree plantation programme, the number of trees planted by students of different classes is given in the following table. Draw a pie diagram showing the information.
| Standard | 5th | 6th | 7th | 8th | 9th | 10th |
| No. of trees | 40 | 50 | 75 | 50 | 70 | 75 |
Sum
Advertisements
Solution
Total number of trees planted = 40 + 50 + 75 + 50 + 70 + 75 = 360
Measure of central angle (θ) = `("Number of scores in the components")/("Total number of scores")xx360^circ`
| Age group (Yrs) | No. of. trees | Central Angle |
| 5th | 40 |
\[\frac{40}{360} \times 360 = 40^\circ\]
|
| 6th | 50 |
\[\frac{50}{360} \times 360 = 50^\circ\]
|
| 7th | 75 | \[\frac{75}{360} \times 360 = 75^\circ\] |
| 8th | 50 |
\[\frac{50}{360} \times 360 = 50^\circ\]
|
| 9th | 70 |
\[\frac{70}{360} \times 360 = 70^\circ\]
|
| 10th | 75 |
\[\frac{75}{360} \times 360 = 75^\circ\]
|
| Total | 360 | 360° |
shaalaa.com
Is there an error in this question or solution?
