Advertisements
Advertisements
Question
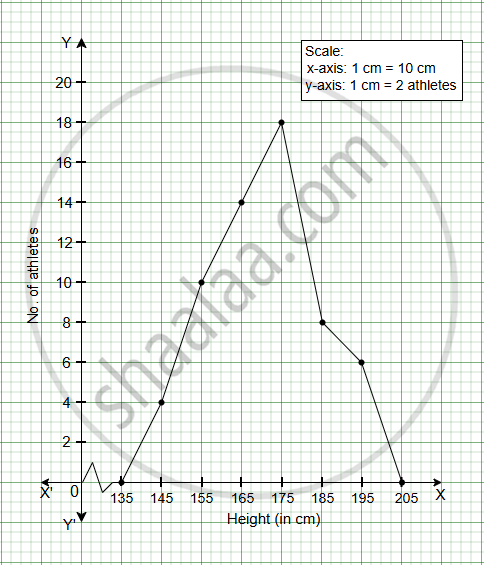
The following table shows the height of 60 athletes in a team. Draw a frequency polygon on the graph.
| Height (in cm) | 140 - 150 | 150 - 160 | 160 - 170 | 170 - 180 | 180 - 190 | 190 - 200 |
| No. of athletes | 4 | 10 | 14 | 18 | 8 | 6 |
Graph
Advertisements
Solution
Mid-value (Class mark) = `"upper limit + lower limit"/2`
| Height (in cm) | Mid-value | No. of athletes |
| 140 - 150 | 145 | 4 |
| 150 - 160 | 155 | 10 |
| 160 - 170 | 165 | 14 |
| 170 - 180 | 175 | 18 |
| 180 - 190 | 185 | 8 |
| 190 - 200 | 195 | 6 |
shaalaa.com
Is there an error in this question or solution?
