Advertisements
Advertisements
Question
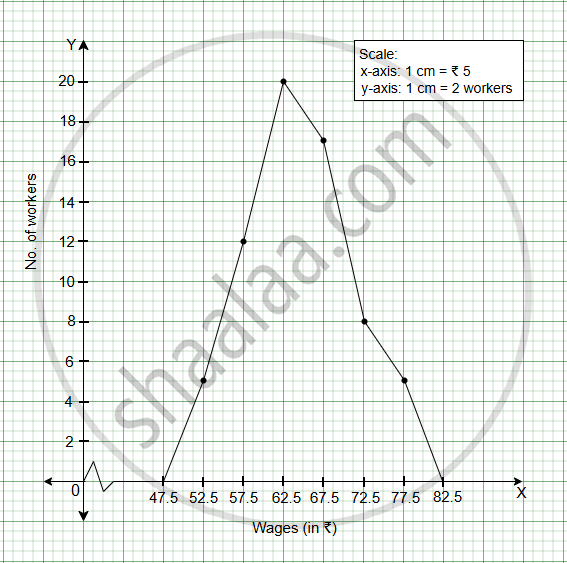
The following table gives daily wages of workers in a factory.
| Wages (in ₹) | 50 - 55 | 55 - 60 | 60 - 65 | 65 - 70 | 70 - 75 | 75 - 80 |
| No. of workers | 5 | 12 | 20 | 17 | 8 | 5 |
Draw a frequency polygon for the above data.
Graph
Advertisements
Solution
| Wages (in ₹) | 50 - 55 | 55 - 60 | 60 - 65 | 65 - 70 | 70 - 75 | 75 - 80 |
| Mid-value | 52.5 | 57.5 | 62.5 | 67.5 | 72.5 | 77.5 |
| No. of workers | 5 | 12 | 20 | 17 | 8 | 5 |
shaalaa.com
Is there an error in this question or solution?
