Advertisements
Advertisements
Question
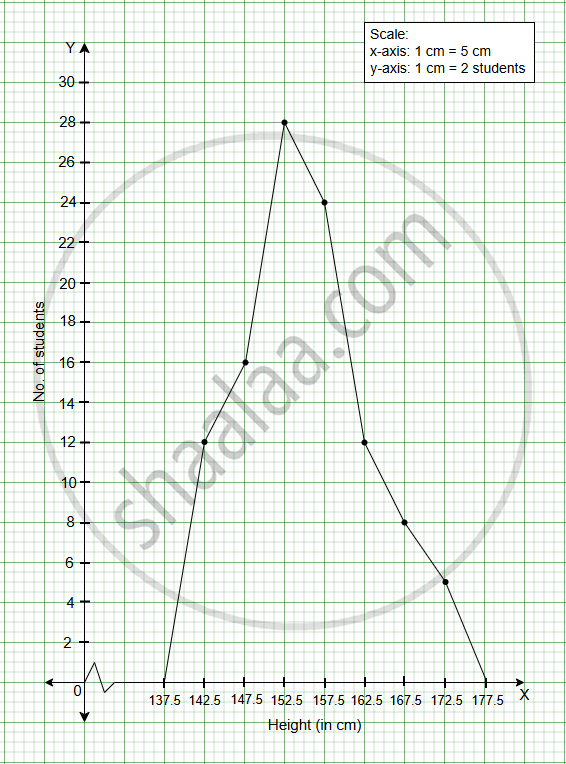
The following distribution shows the height of students in a school.
| Height (in cm) | 140 - 145 | 145 - 150 | 150 - 155 | 155 - 160 | 160 - 165 | 165 - 170 | 170 - 175 |
| No. of students | 12 | 16 | 28 | 24 | 12 | 8 | 5 |
Draw a frequency polygon.
Graph
Advertisements
Solution
| Height (in cm) | Mid-value | No. of students |
| 140 - 145 | 142.5 | 12 |
| 145 - 150 | 147.5 | 16 |
| 150 - 155 | 152.5 | 28 |
| 155 - 160 | 157.5 | 24 |
| 160 - 165 | 162.5 | 12 |
| 165 - 170 | 167.5 | 8 |
| 170 - 175 | 172.5 | 5 |
shaalaa.com
Is there an error in this question or solution?
