Advertisements
Advertisements
Question
The data given below represent the marks obtained by 35 students.
| 21 | 26 | 21 | 20 | 23 | 24 | 22 | 19 | 24 |
| 26 | 25 | 23 | 26 | 29 | 21 | 24 | 19 | 25 |
| 26 | 25 | 22 | 25 | 23 | 27 | 26 | 24 | 25 |
| 30 | 25 | 23 | 27 | 28 | 24 | 28 | 28 |
Taking class intervals 19 – 20, 21 – 22, etc., make a frequency distribution for the above data. Then construct a combined histogram and frequency polygon for the distribution.
Graph
Advertisements
Solution
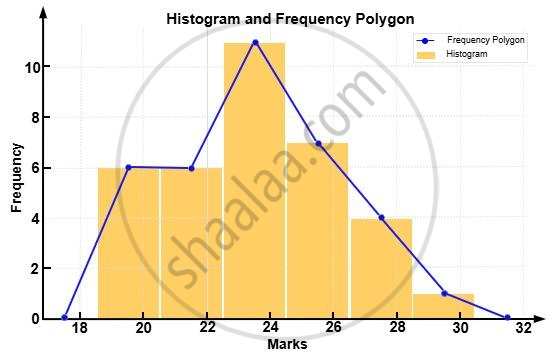
Here is the combined histogram and frequency polygon for the data given. It shows the distribution of marks in class intervals like 19 – 20, 21 – 22, etc., for 35 students. The bars represent the frequency per interval and the blue line traces the frequency polygon through class midpoints.
shaalaa.com
Is there an error in this question or solution?
