Advertisements
Advertisements
Question
Study the flow chart given below and complete the equation that follows by identifying 1, 2, 3 and 4.
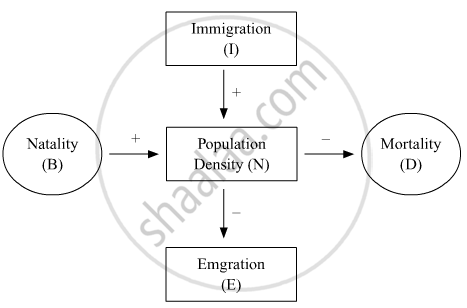
Nt + 1 = Nt + {(1+ 2) − (3 + 4)}
One Line Answer
Advertisements
Solution
Nt + 1 = Nt + {(B+ I) − (D + E)}
shaalaa.com
Is there an error in this question or solution?
