Advertisements
Advertisements
प्रश्न
Study the flow chart given below and complete the equation that follows by identifying 1, 2, 3 and 4.

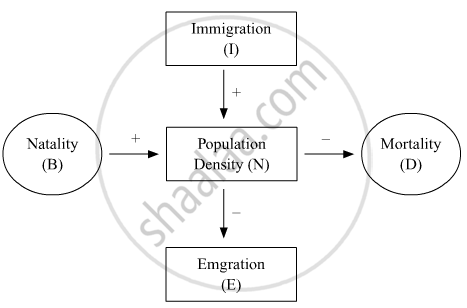
Nt + 1 = Nt + {(1+ 2) − (3 + 4)}
Advertisements
उत्तर
Nt + 1 = Nt + {(B+ I) − (D + E)}
APPEARS IN
संबंधित प्रश्न
(a) Name the two growth models that represent population growth and draw the respective growth curves they represent.
(b) State the basics for the difference in the shape of these curves
(c) Which one of the curves represents the human population growth at present? Do you think such a curve is sustainable? Give reason in support of your answer.
"Analysis of age-pyramids for human population can provide important inputs for long-term planning strategies." Explain.
Define the carrying capacity.
Nutrient enrichment of water body result.
The phenomenal and rapid increase of population in a short period is called ______.
Population having large number of postreproductive and small number of prereproductive age group is called
The density of a population in a habitat per unit area is measured in different units. Write the unit of measurement against the following:
Bacteria
The density of a population in a habitat per unit area is measured in different units. Write the unit of measurement against the following:
Deer
The density of a population in a habitat per unit area is measured in different units. Write the unit of measurement against the following:
Fish

What type of population growth is represented by the above age pyramid?
