Advertisements
Advertisements
Question
Draw the graph of equation 3x – 4y = 12. Use the graph drawn to find:
- y1, the value of y, when x = 4.
- y2, the value of y, when x = 0.
Advertisements
Solution
First, prepare a table as follows:
| X | –1 | 0 | 1 |
| Y | `-(15)/(4)` | – 3 | `-(9)/(4)` |
The graph of the equation can be drawn as follows:
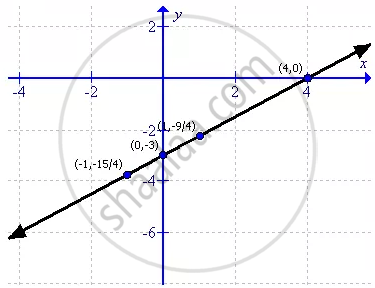
From the graph, it can verify that
If x = 4 the value of y = 0
If x = 0 the value of y = –3.
RELATED QUESTIONS
Draw the graph of the equation given below.
2x + y = 1
The following table gives production yield in kg per hectare of wheat of 100 farms of a village:
| Production yield (kg/hectare): |
40 – 45 | 45 – 50 | 50 – 55 | 55 – 60 | 60 – 65 | 65 – 70 |
| Number of farms | 4 | 6 | 16 | 20 | 30 | 24 |
Change the distribution to 'a more than' type distribution, and draw its ogive.
Draw the graph for the linear equation given below:
x - 5 = 0
Draw the graph for the linear equation given below:
5x+ y = 0.
Draw the graph for the linear equation given below:
x = - 2y
Draw the graph for the linear equation given below:
y = `4x - (5)/(2)`
Draw the graph for the equation given below:
2x - 5y = 10
Draw the graph for the equation given below:
`(1)/(2) x + (2)/(3) y = 5`.
On the same graph paper, plot the graphs of y = 2x - 1, y = 2x and y = 2x + 1 from x = - 2 to x = 4. Are the graphs (lines) drawn parallel to each other?
Draw a graph of each of the following equations: 5x + 2y = 16
