Advertisements
Advertisements
Question
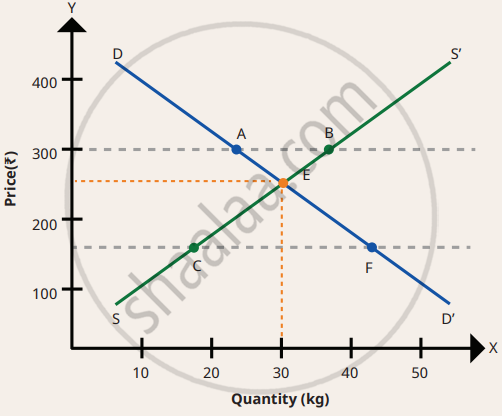
Shows the demand curve DD’ and supply curve SS’. Based on the figure, answer the following questions:
- What does point E represent in this market?
- What is the equilibrium price and equilibrium quantity at point E?
- Point A lies on DD’. Point B lies on SS’. What do the points A and B indicate about demand and supply? What does the gap between A and B (both on the upper dashed price line) represent?
- Point F lies on DD’. Point C lies on SS’. What do the points F and C indicate about demand and supply? What does the gap between C and F (both on the lower dashed price line) represent?
- If the price stays at the lower dashed line, what could happen next in a free market?
Long Answer
Advertisements
Solution
- Point E represents the market equilibrium, where quantity demanded equals quantity supplied.
- Equilibrium Price = ₹ 250
Equilibrium Quantity = 30 kg - Point A shows the quantity demanded, and point B shows the quantity supplied at a higher price. The gap between them represents excess supply (surplus).
- Point F shows the quantity demanded, and point C shows the quantity supplied at a lower price. The gap between them represents excess demand (shortage).
- The shortage will create pressure on prices to rise. As the price increases, demand will decrease, and supply will increase until the market reaches equilibrium.
shaalaa.com
Is there an error in this question or solution?
