Advertisements
Advertisements
Questions
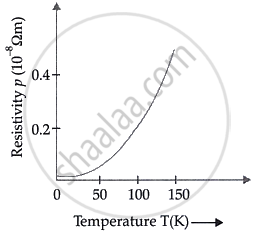
Show variation of resistivity of copper as a function of temperature in a graph.
Show the variation of resistivity of copper with rise in temperature.
Draw a plot of the resistivity of copper as a function of temperature.
Graph
Short Answer
Advertisements
Solution
The relationship between the resistivity of copper and temperature is parabolic. The graph indicates that the resistivity of copper escalates with an increase in temperature. It is acknowledged that, regardless of the temperature, copper possesses a specific resistance.

shaalaa.com
Notes
Students should refer to the answer according to their questions.
Is there an error in this question or solution?
