Advertisements
Advertisements
प्रश्न
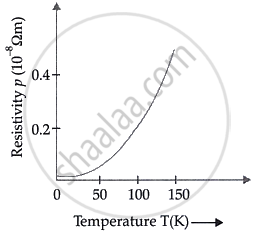
Show variation of resistivity of copper as a function of temperature in a graph.
Show the variation of resistivity of copper with rise in temperature.
Draw a plot of the resistivity of copper as a function of temperature.
Advertisements
उत्तर
The relationship between the resistivity of copper and temperature is parabolic. The graph indicates that the resistivity of copper escalates with an increase in temperature. It is acknowledged that, regardless of the temperature, copper possesses a specific resistance.

Notes
Students should refer to the answer according to their questions.
APPEARS IN
संबंधित प्रश्न
The heat developed in a system is proportional to the current through it.
The specification on a heater coil is 250 V, 500 W. Calculate the resistance of the coil. What will be the resistance of a coil of 1000 W to operate at the same voltage?
In Figure 3 given below, find the value of resistance x for which points A and B are at the same potential:

figure 3
What is the colour code of a carbon resistor having a resistance of 470 Ω and a tolerance of 5%?
The ______, a property of materials C, Si, and Ge depends upon the energy gap between their conduction and valence bands.
Assertion: Bending a wire does not effect electrical resistance.
Reason: Resistance of wire is proportional to resistivity of material.
A man covers his body with a blanket of thickness 4 mm. His temperature is 37°C and that of the atmosphere is 27°C. If the coefficient of thermal conductivity of wool is 1.2 × 10⁻⁵ MKS units, heat lost by him per hour per square meter area is:
The resistivity of a wire ______
Consider four conducting materials copper, tungsten, mercury and aluminium with resistivity ρC, ρT, ρM and ρA respectively. Then:
