English

See the diagram given below: Mark the (i) Short-down point (ii) Break-even point

Advertisements
Advertisements

Question

See the diagram given below:
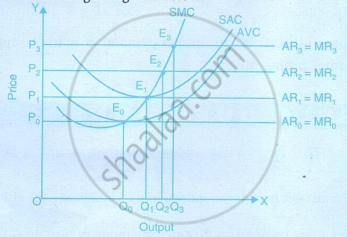
The image shows how a firm's equilibrium output changes across multiple price levels (P₀ to P₃) which is used to derive the firm's short-run supply curve. It highlights key operational points along the rising (SMC) curve, starting from the shutdown point (E₀) at the minimum of the AVC curve up through various profit-earning levels.

Mark the (i) Short-down point (ii) Break-even point

Very Short Answer
Advertisements

Solution

  1. Short-down point: E₀ - where price equals minimum AVC.
  2. Break-even point: E₁ - where price equals minimum SAC and the firm earns normal profit.
shaalaa.com
  Is there an error in this question or solution?
Chapter 11: Determination of Equilibrium Price and Output Under Perfect Competition - TEST YOURSELF QUESTIONS [Page 212]

APPEARS IN

Frank Economics [English] Class 12 ISC
Chapter 11 Determination of Equilibrium Price and Output Under Perfect Competition
TEST YOURSELF QUESTIONS | Q 10. | Page 212
Share
Notifications

Englishहिंदीमराठी


      Forgot password?
Use app×