Advertisements
Advertisements
Question
Percentage of passes of a certain school at the I.C.S.E. examination for five consecutive years.
| Year | 1994 | 1995 | 1996 | 1997 | 1998 |
| % on passes | 96 | 100 | 98 | 85 | 92 |
Draw bar graph to represent the data.
Graph
Advertisements
Solution
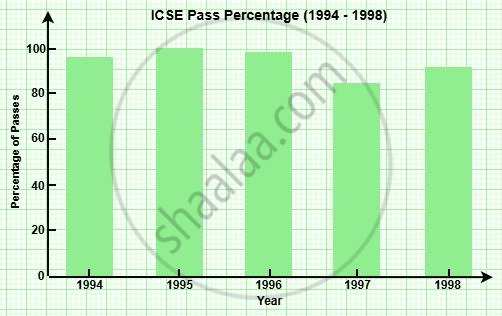
Here is the bar graph representing the ICSE pass percentages for the years 1994 to 1998. It clearly shows the highest pass rate in 1995 (100%) and the lowest in 1997 (85%).
shaalaa.com
Is there an error in this question or solution?
